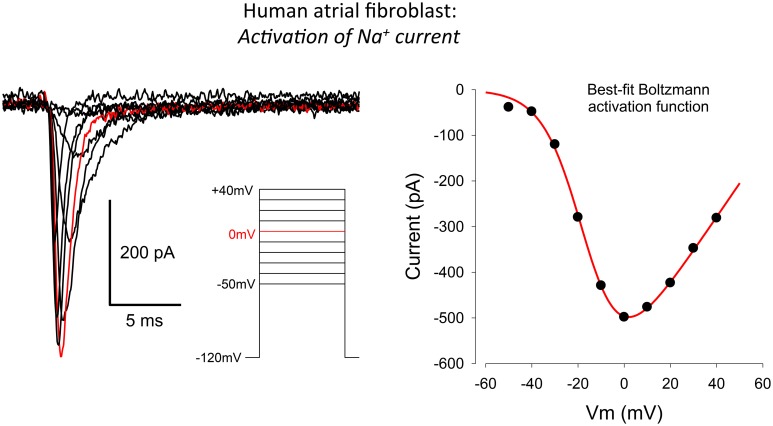
Figure 3.
Whole-cell voltage clamp records illustrating the activation of the transient inward Na+ current in human atrial myofibroblasts. Raw data (10 superimposed current records) elicited by 100 ms depolarizing clamp steps from −50 to +40 mV are shown; the red trace indicates the current elicited at 0 mV. The voltage clamp protocol is shown in the inset. The plot in the right-hand panel is an I–V curve. It was constructed by plotting the peak inward current at each selected voltage clamp depolarization level. The patch pipette solution in this experiment was Cs+-rich (Methods), to block the large and rapidly activating IK-Ca, which obscured INa at potentials positive to about +30 mV (see Figure 1 and text in Results).

