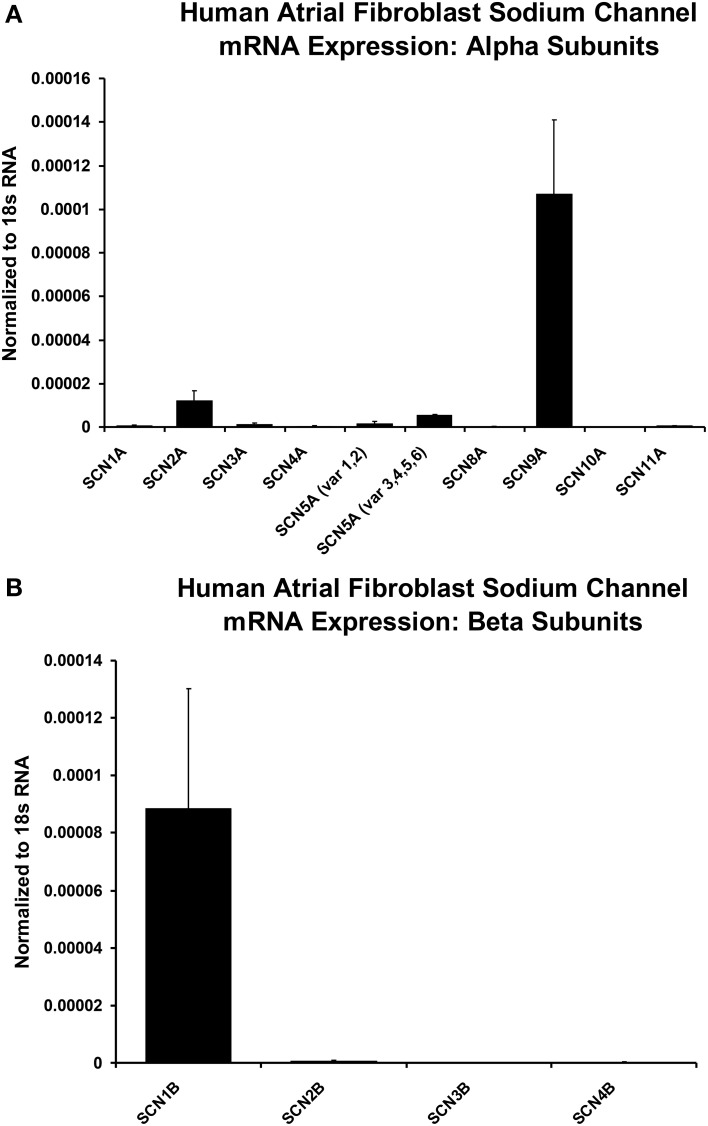
Figure 5.
Histograms of normalized data from PCR measurements of relative levels of Na+ channel α and β subunits, based on RNA derived from populations of isolated human atrial myofibroblasts maintained in 2-D tissue culture. Note from panel (A) the predominant α subunits are SCN9A and SCN2A; Panel (B) shows that the strongest β subunit signal is for β1. However, the cardiac isoform of Na+ current α subunit, SCN5A, also can be detected (see Discussion). Sample size for mRNA measurements are from n = 3 individual samples for plated and collagen treated fbs (only plated values are shown). The statistical analysis was based on the difference between plated and collagen treated cells, with a simple unpaired t-test to compare gene expression under the two conditions.

