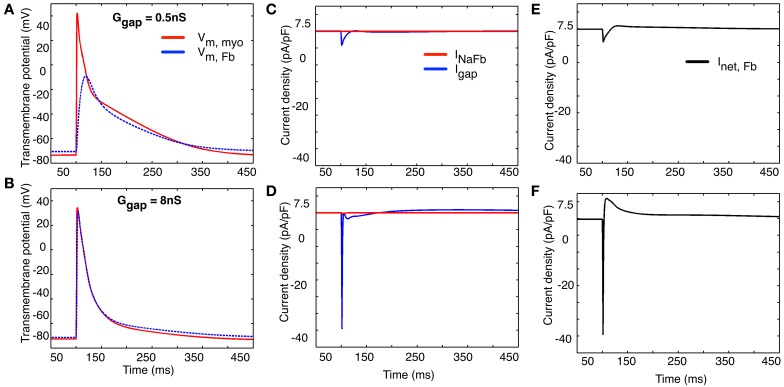
Figure 9.
Illustration of two selected values of the effects of coupling resistance on the electrotonic membrane potential (panels A,B), “gap current” and current flow between the two cell populations (1 myocyte: 1 myofibroblast, panels C,D) and the net transmembrane current in the collective myofibroblast population (panels E,F). See text in Results for further explanation.

