Figure 3.

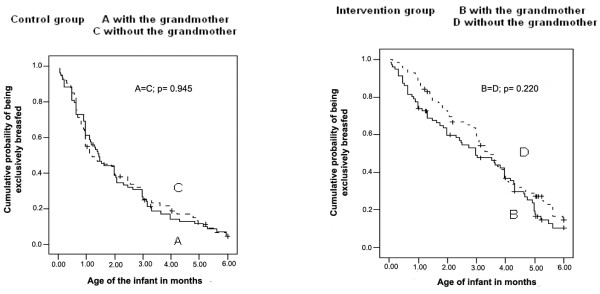
Kaplan-Meier curve of EB in the first 6 months of life in control group (Aand C) and intervention group (B and D), according to cohabitation with the maternalgrandmother.

Kaplan-Meier curve of EB in the first 6 months of life in control group (Aand C) and intervention group (B and D), according to cohabitation with the maternalgrandmother.