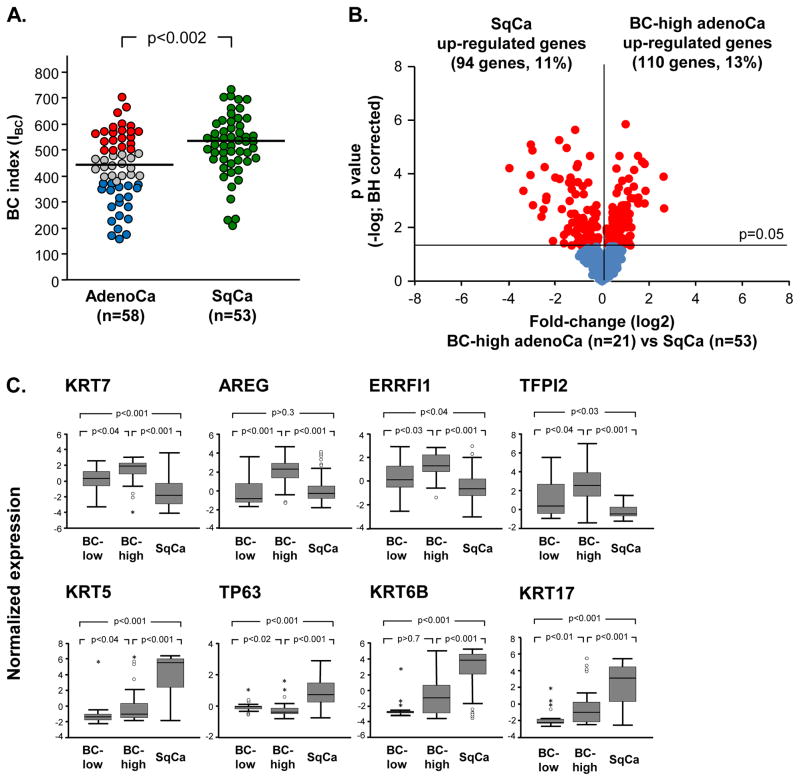
Figure 4.
Comparative analysis of the airway basal cell (BC) signature expression in lung adenocarcinoma (adenoCa) and lung squamous cell carcinoma (SqCa). A. Lung adenoCa (n=58)and SqCa (n=53) cases from the Bild et al [15] data set were analyzed. The BC index (IBC) was calculated based on median levels of adenoCa subjects for each gene. Red circles – BC-high adenoCa, grey circles – BC-intermediate adenoCa, blue circles – BC-low adenoCa, green circles – SqCa. The median IBC for both types of cancer (436 - adenoCa, 529 - SqCa) are highlighted with a horizontal lines; p value indicated was determined by Mann-Whitney test. B. Volcano plot comparing expression of the airway BC signature genes [13] in BC -high lung adenoCa (n=21) to SqCa(n=53) from data set of Bild et al. [15]. Y-axis corresponds to the negative log of p value and the x-axis corresponds to the log2-transformed fold-change. Red dots -significant genes (p<0.05 with Benjamini-Hochberg correction); blue dots -genes with no significant difference between the groups. C. Airway BC signature gene examples differentially expressed in BC-high adenoCa (n=21) vs SqCa (n=53) from dataset of Bild et al [15]. In all panels, log2-transformed normalized gene expression levels are based on the microarray analysis. Outliers were indicated on the basis of interquartile range (IQR); ° −1.5 x IQR to 3 x IQR, * -more or less than 3 x IQR.

