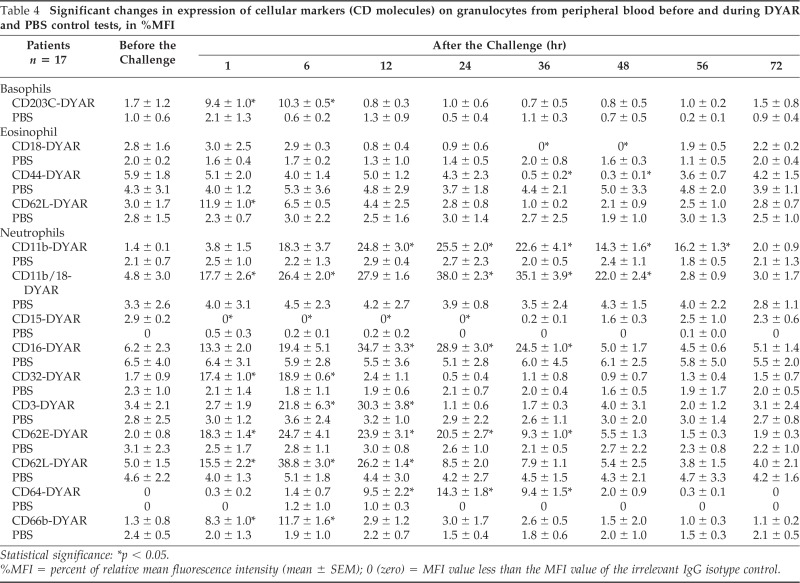
Table 4.
Significant changes in expression of cellular markers (CD molecules) on granulocytes from peripheral blood before and during DYAR and PBS control tests, in %MFI

Statistical significance: *p < 0.05.
%MFI = percent of relative mean fluorescence intensity (mean ± SEM); 0 (zero) = MFI value less than the MFI value of the irrelevant IgG isotype control.
