
Fig. 8.
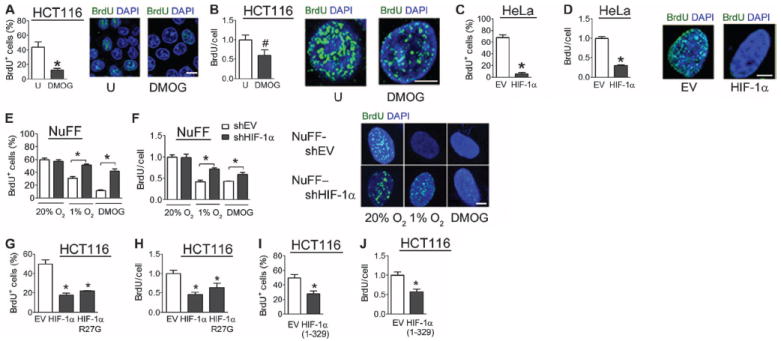
HIF-1α inhibits firing of replication origins and inhibits DNA synthesis. (A and B) Untreated or DMOG-treated HCT116 cells were exposed to a 5-min pulse of BrdU and analyzed by confocal microscopy. The percentage of BrdU+ cells was determined (A), and the number of sites of BrdU incorporation among replicating cells only was determined (B). n = 10 to 20 cells from two independent experiments. Scale bars, 10 μm (A) and 5 μm (B). (C and D) HeLa cells cotransfected with a GFP vector and either empty vector (EV) or HIF-1α vector were pulse-labeled with BrdU and analyzed by confocal microscopy. Transfected cells were analyzed for the percentage of BrdU+ cells (C) and BrdU incorporation among replicating cells only (D). n = 10 to 20 cells from two independent experiments. Scale bar, 5 μm. (E and F) Newborn human foreskin fibroblasts stably transfected with empty shRNA vector (NuFF-shEV) or vector encoding shRNA against HIF-1α (NuFF–shHIF-1α) were left untreated, treated with DMOG, or exposed to 1% O2, pulse-labeled with BrdU, and analyzed by confocal microscopy for sites of BrdU incorporation. The percentage of cells positive for BrdU incorporation (E) and BrdU incorporation among BrdU+ cells only (F) were determined. n = 10 to 20 cells from two independent experiments. Scale bar, 5 μm. (G and H) HCT116 cells transfected with EV or vector encoding HIF-1α or HIF-1α (R27G) were pulse-labeled with BrdU and analyzed. n = 15 to 30 cells from three independent experiments. (I and J) HCT116 cells transfected with either EV or FLAG–HIF-1α (1 to 329) vector were pulse-labeled with BrdU and analyzed. The percentage of cells positive for BrdU incorporation (I) and relative BrdU foci among BrdU+ cells only (J) were determined. n = 15 to 30 cells from three independent experiments. Results are shown as means ± SEM. *P < 0.01; #P < 0.05.