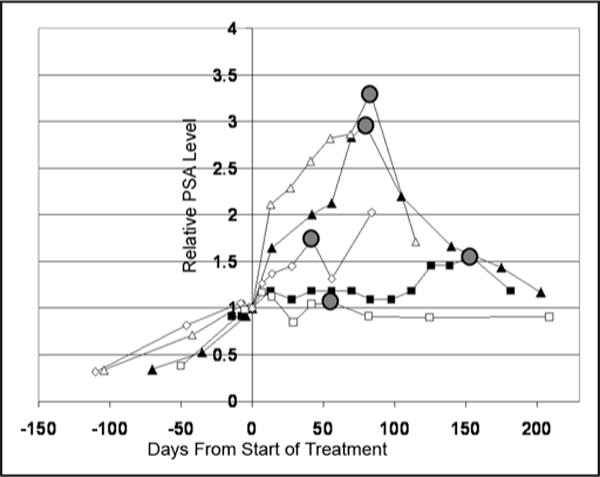
Figure 3.

Decrease PSA levels in five patients after stopping CEP-701. Lines represent Normalized PSA levels plotted vs. time for each patient. Day that CEP-701 was stopped is by the gray circle. Two patients completed study on scheduled day 84, two patients ended study early due to toxicity and one patient continued on study until day 154 due to stable PSA (i.e., <50% increase in PSA).
