Figure 6.

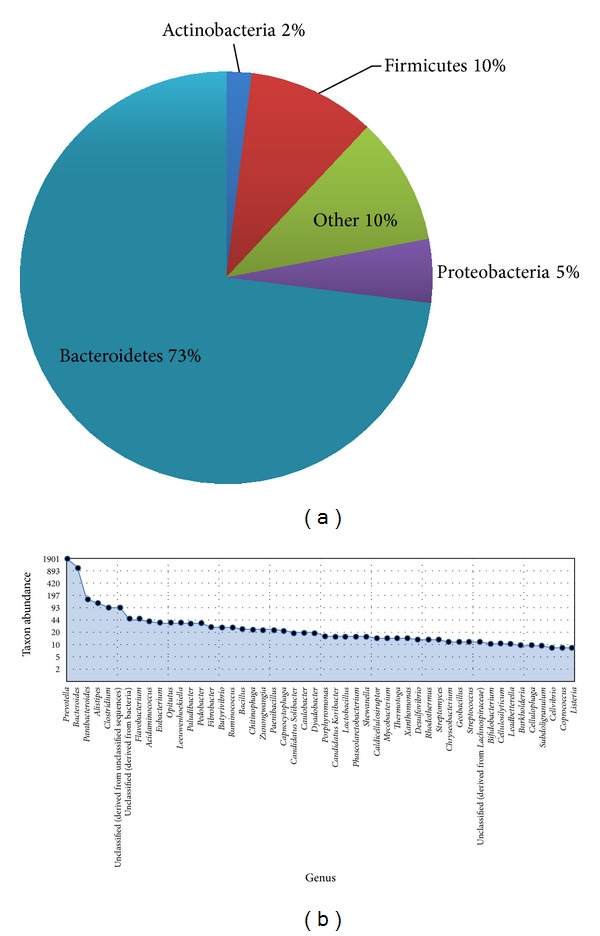
Taxonomic classification of putative CAZymes contigs and their microbial origin. (a) The pie chart shows the abundance of phylum and (b) genus abundances ordered from the most abundant to least abundant.

Taxonomic classification of putative CAZymes contigs and their microbial origin. (a) The pie chart shows the abundance of phylum and (b) genus abundances ordered from the most abundant to least abundant.