
Figure 2.
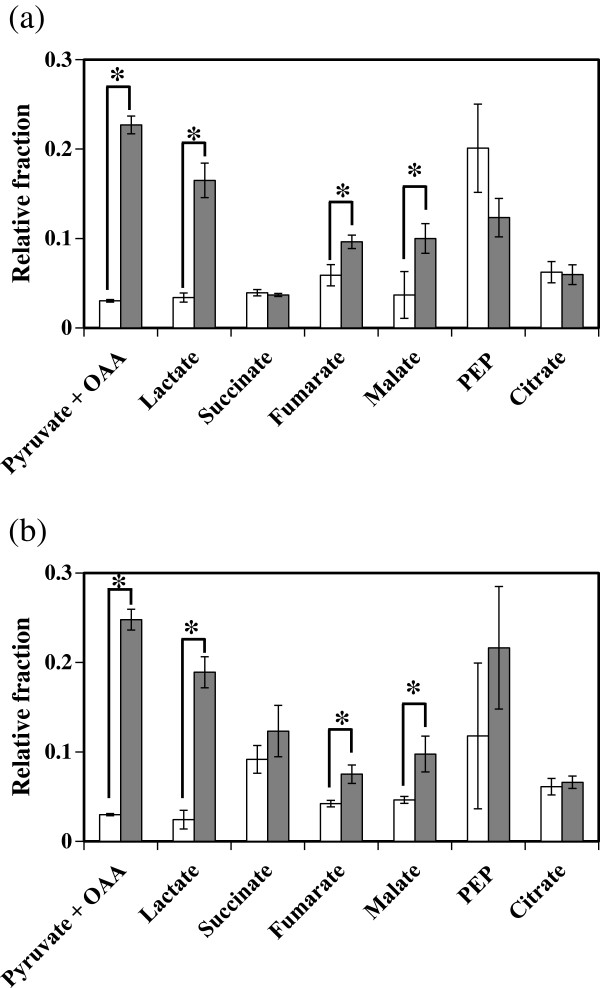
Incorporation of CO2 into several metabolites inside and outside of the cells. The vertical axis represents the relative fraction of 13C-labeled metabolites, which was calculated as follow as: m1/ , where m1 and mi are the corrected intensities and n is the number of carbon atoms in metabolites (n = 3 in the case of lactate, for example). (a) Intracellular metabolites. (b) Extracellular metabolites. White and gray bars represent the ratios of each metabolite in media containing NaHCO3, and NaH13CO3, respectively. Error bars and asterisks indicate standard deviations and significant difference (*P < 0.01), respectively.