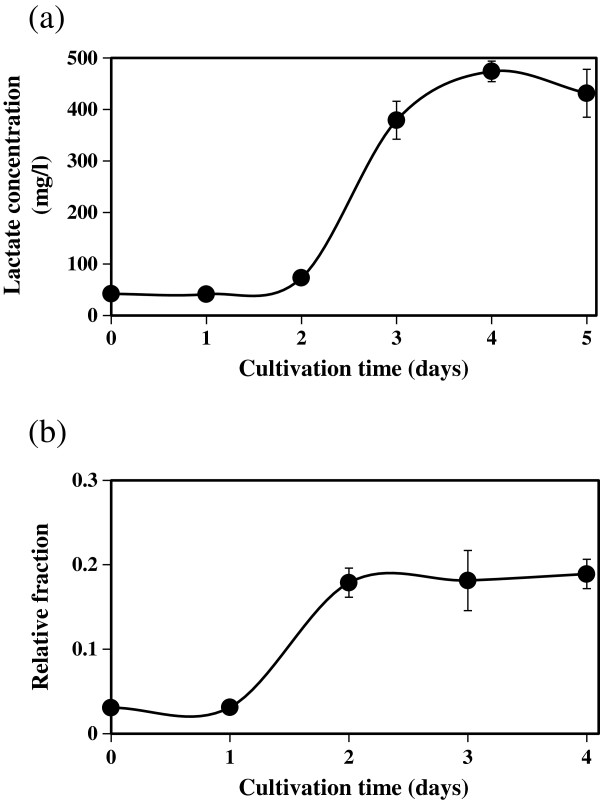
Figure 4.

Lactate secretion accompanied with CO2 fixation. (a) The time course of lactate concentration in cultivation supernatants. (b) The time course of relative fraction of lactate in cultivation supernatants. Relative fractions were calculated as described in Figure 2. Error bars represent standard deviations.
