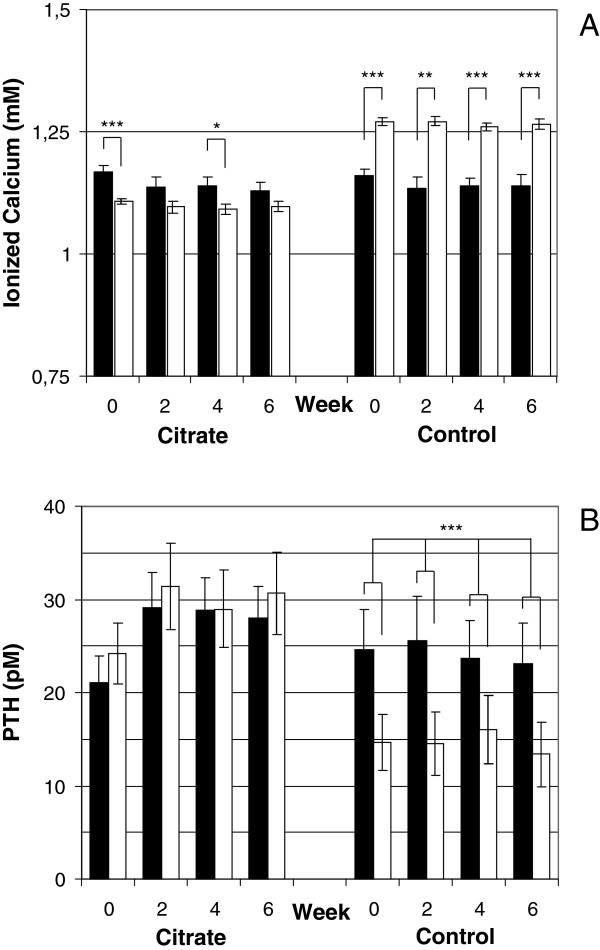
Figure 3.

Analyses of calcium balance over the study period. A) Intra-dialytic change in plasma ionized calcium levels at each sampling occasion when using citrate dialysis fluid compared to control. B) Intra-dialytic change in plasma PTH levels at each sampling occasion when using citrate dialysis fluid compared to control. Black bars represent pre-dialysis values and white bars post-dialysis values. Bars show means and error bars represent SEM, n = 20. * = p < 0.05, ** = p < 0.01 and *** = p < 0.001 and ** = p < 0.01.
