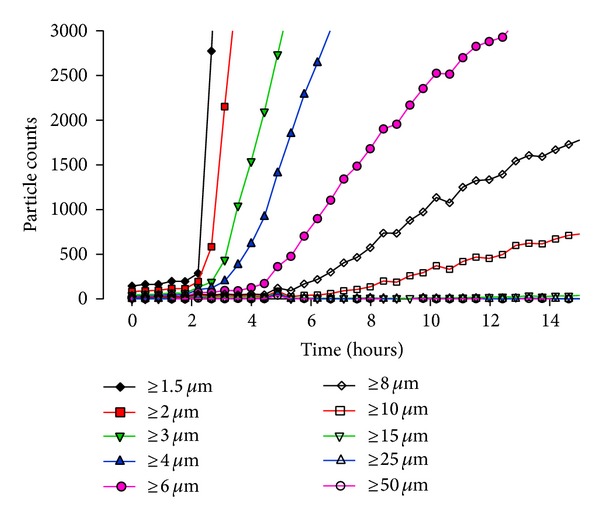
Figure 3.

The particle size data versus time for a 15-hour period presenting the cumulative counts at various sizes including ≥1.5 µm (diamonds), ≥2.0 µm (squares), ≥3.0 µm (downward triangles), ≥4.0 µm (upward triangles), ≥6.0 µm (circles), ≥8.0 µm (empty diamonds), ≥10.0 µm (empty squares), ≥15 µm (empty downward triangles), ≥25 µm (empty upward triangles), and ≥50 µm (empty circles), for the 12.7 mmol/L [Ca2+] sample.
