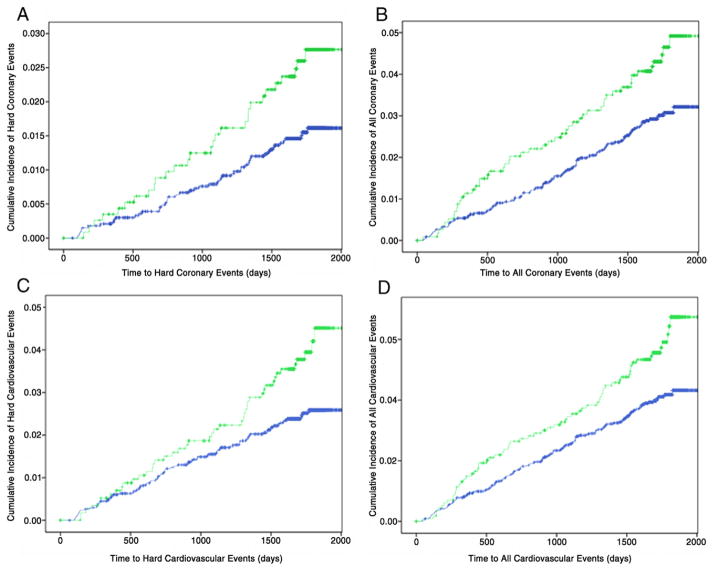
Figure 2. Kaplan-Meier Analyses for the Secondary Atherosclerotic Cardiovascular Endpoints.
Kaplan-Meier curves illustrating cumulative incidences by absence (blue) and presence (green) of baseline regional myocardial dysfunction for (A) hard coronary events (log-rank for difference, p = 0.019), (B) all coronary events (log-rank for difference, p = 0.016); (C) hard cardiovascular events (log-rank for difference, p = 0.012); and (D) all cardiovascular events (log-rank for difference, p = 0.011).

