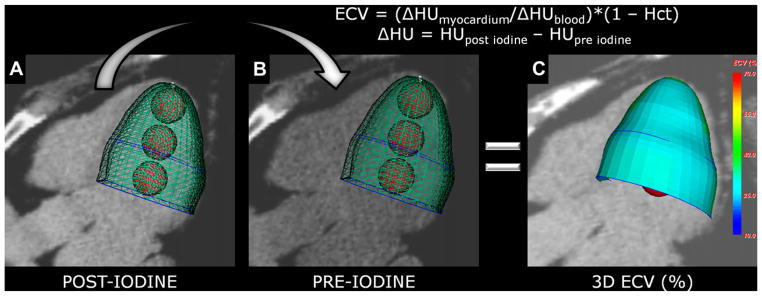
Figure 2.

Calculation of the 3-dimensional (3D) extracellular volume (ECV) map. (A) 3D modeling after iodine for mean measurements of myocardium (green mesh) and blood pool (red balls) densities (in HU). (B) Same mesh is used to extract myocardium and blood pool densities (in HU) from the data set before -iodine, after image registration. (C) The software automatically calculates mean ECV for each segment and then maps the mean ECV onto the 3D model. Hct, hematocrit.
