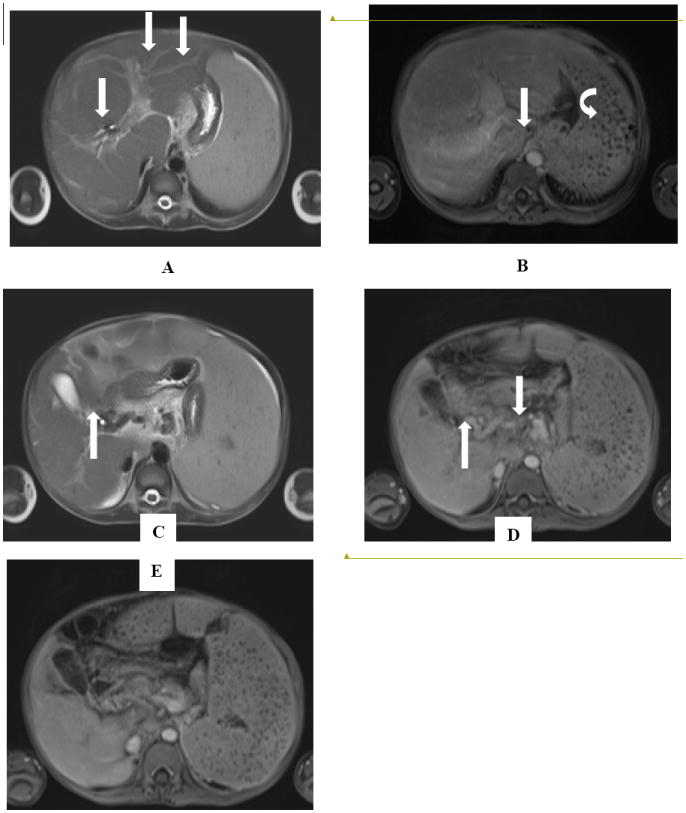
Figure 3.

(A) Axial T2 HASTE image show hyperintense periportal fibrosis (PPF) running along the tributaries of the portal vein (arrows). (B) Axial T1 post-gadolinium VIBE image shows enhancement of the periportal fibrosis (arrows). Also seen is splenomegaly with Gamna-Gandy bodies, indicative of portal hypertension (curved arrow) (C) Axial T2 HASTE and (D) Axial T1 post-gadolinium VIBE image shows cavernous transformation of the portal vein (CTPV) showing small enhancing flow voids around the right portal vein (arrows). (E) Axial T1 post-gadolinium VIBE image shows a hypoenhancing thrombosed portal vein. (arrow).
