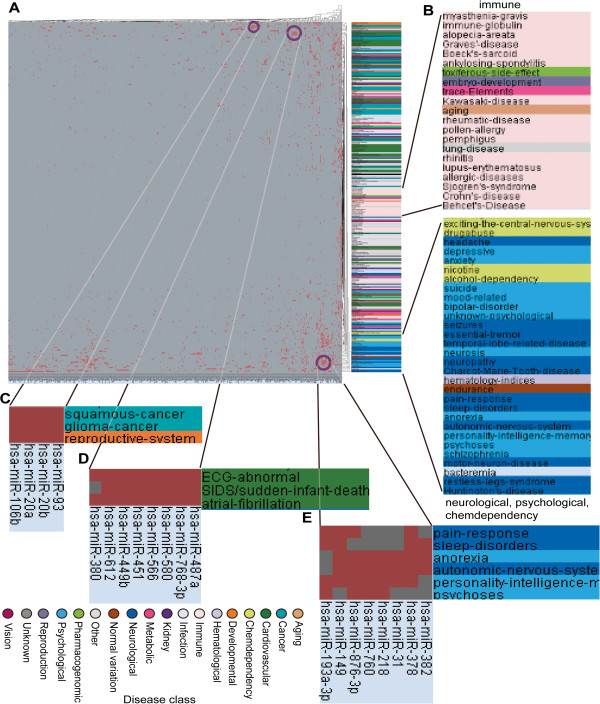
Figure 4.

Hierarchical clustering of the miRNA-disease network. (A) Hierarchical clustering between 454 miRNAs and 261 diseases. Red cells denote links between the corresponding miRNAs and diseases. Disease labels are colored according to disease class. (B) Zoom-in plot of disease labels in Figure 4A. (C), (D), and (E) are zoom-in plots of corresponding purple circle regions in Figure 4A.
