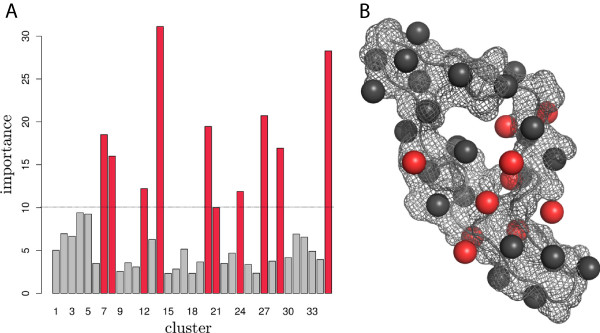
Figure 2.

Importance analysis. A: Importance for each cluster for the classification process, measured as sum of all decreases in Gini impurity. Highly important clusters (importance >10) are colored in red. B: Clusters are shown as spheres in the V3 crystal structure. Highly important clusters (importance >10) are shown as red spheres.
