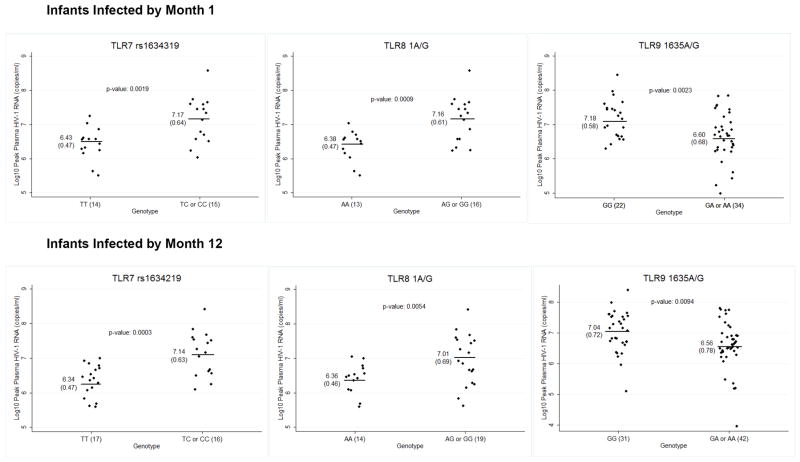
Figure 2.
SNP Variations Associated with Peak Plasma HIV-1 RNA Levels (log10 copies/ml) in Infants Infected with HIV-1 by 1 and 12 Months of Age*
NOTE: Log10 peak plasma HIV-1 RNA levels are displayed separately for infants who acquired HIV-1 by 1 month of age and all infants who acquired HIV-1 by 12 months of age. Each graph presents the mean and standard deviation of peak plasma HIV-1 RNA level stratified by genotype and the p-value corresponding to the mean difference. The number of individuals in each genotypic category is specified on the x-axis next to the genotype.
* Uncorrected p-values are displayed for the TagSNP TLR7 rs1634319

