
Figure 1.
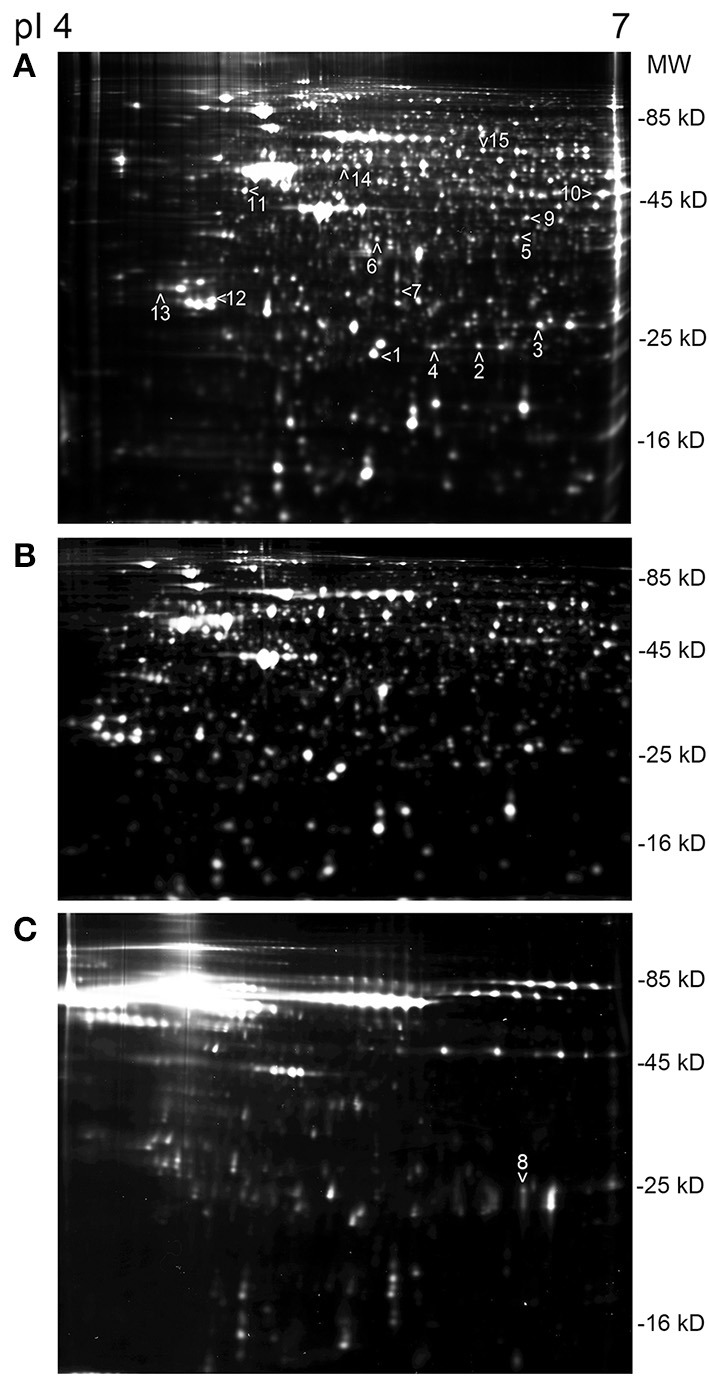
An example sets of 2D-DIGE protein profiles of SH-SY5Y cells. (A) Differentiated SH-SY5Y cells, at the 48 h time-point where the number of protein spots was the greatest. The arrow heads indicate the picked proteins, done from the silver stained gels; protein ID: (1) PRX2, (2) PRX3, (3) PRX6, (4) DJ-1, (5) BLVRA, (6) DDAH1, (7) DDAH2, (8) TIMP2, (9) SEPT2, (10) ENOA, (11) ENOG, (12) 14-3-3γ, (13) 14-3-3ε, (14) RUFY3, (15) CRMP2. (B) Undifferentiated SH-SY5Y neuroblastoma cells showed the least number of spots, in comparison to differentiated SH-SY5Y cells in (A). (C) Protein profile of the culture medium of the differentiated SH-SY5Y cells at the 72 h time-point. Protein ID 8, TIMP2, was picked from the medium gel. The strip pI range was the same in all shown gels.