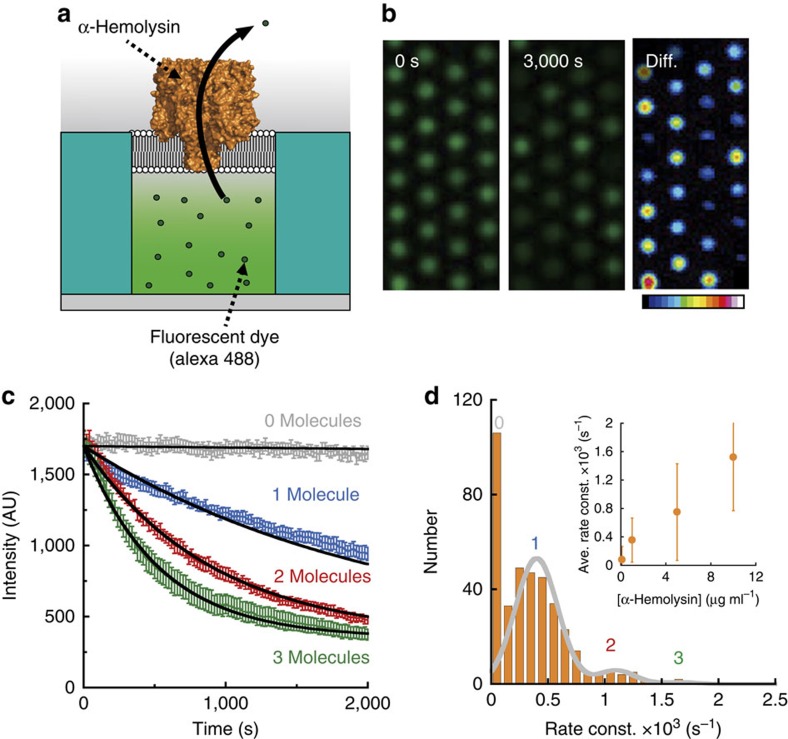
Figure 3. Passive transport of fluorescent dye by α-hemolysin.
(a) Schematic illustration of passive transport of α-hemolysin reconstituted into ALBiCs. The fluorescent dye (Alexa 488) diffused out from the chamber via the hole on the membrane formed by α-hemolysin. (b) Fluorescent images of the passive transport activity in the chambers. The images were recorded just after α-hemolysin injection (left panel) and 3,000 s later (middle panel). The right panel, diff., shows the intensity difference between these two images in the form of a colour gradient. (c) Continuous recording of the passive transport activity of 1 μg ml−1 α-hemolysin. The average of four representative chambers containing 0 α-hemolysin pores, that of four chambers containing 1 α-hemolysin pore, that of four chambers containing 2 α-hemolysin pores and that of four chambers containing 3 α-hemolysin pores were plotted as grey, blue, red and green, respectively. Over the study period, activity was observed as a continuous decrease in the fluorescence concentration, indicating that α-hemolysin was not inactivated temporarily. Solid lines represent the fittings with the single exponential decay: y=C1 exp(−k ˙ t)+C2, where k is the rate constant of passive transport. Error bars represent s.d. (d) In the histogram, the number of chambers is plotted versus the rate constant of passive transport, k. The four peaks can be attributed to occupancies of 0, 1, 2 or 3 α-hemolysin pores per chamber. They were fitted to a sum of Gaussians. The inset is the average (Ave.) rate constant (const.) against the concentration of α-hemolysin in the flow cell. The grey solid line represents the linear fitting with a correlation coefficient of 0.98.

