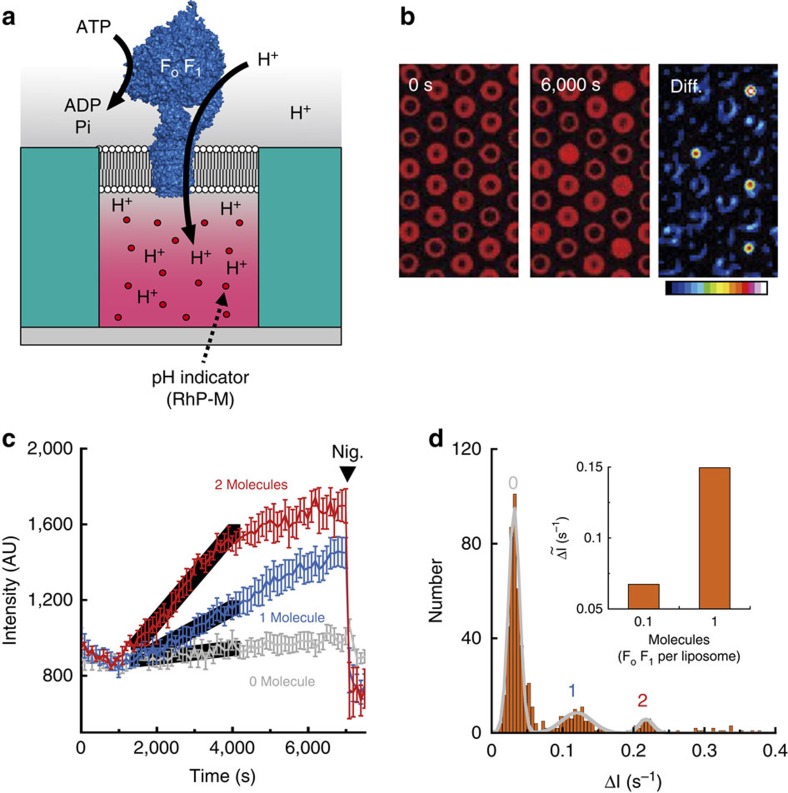
Figure 4. Active transport of protons by F0F1-ATP synthase (F0F1).
(a) Schematic illustration of F0F1 active transport. F0F1 pumps the proton from outside to inside the microchamber by hydrolysing ATP. The fluorescent pH indicator (RhP-M) is encapsulated in the microchamber for pH monitoring. (b) Fluorescence images of the proton pumping of F0F1 in the chambers. The images were recorded just after the injection of 200 μM ATP (left panel) and 6,000 s later (middle panel). The right panel, diff., shows the intensity difference between the left and middle panels in the form of a colour gradient. (c) Continuous recording of proton pumping. The average of 12 representative chambers containing 0 molecules, that of 12 chambers containing 1 molecule and that of 12 chambers containing 2 molecules of active F0F1 were plotted as grey, blue and red, respectively. Over the study period, activity was observed as a continuous increase in fluorescence intensity. Black solid lines represent the linear fittings. Error bars represent s.d. (d) In the histogram, the number of chambers is plotted versus the slope of fluorescence increments from 1,500 to 4,000 s. The three peaks can be attributed to occupancies of 0, 1 or 2 active F0F1 molecules per chamber. They were fitted to a sum of Gaussians. The inset is the average slope of fluorescence increments against the average number of active F0F1 molecules reconstituted in a single liposome.

