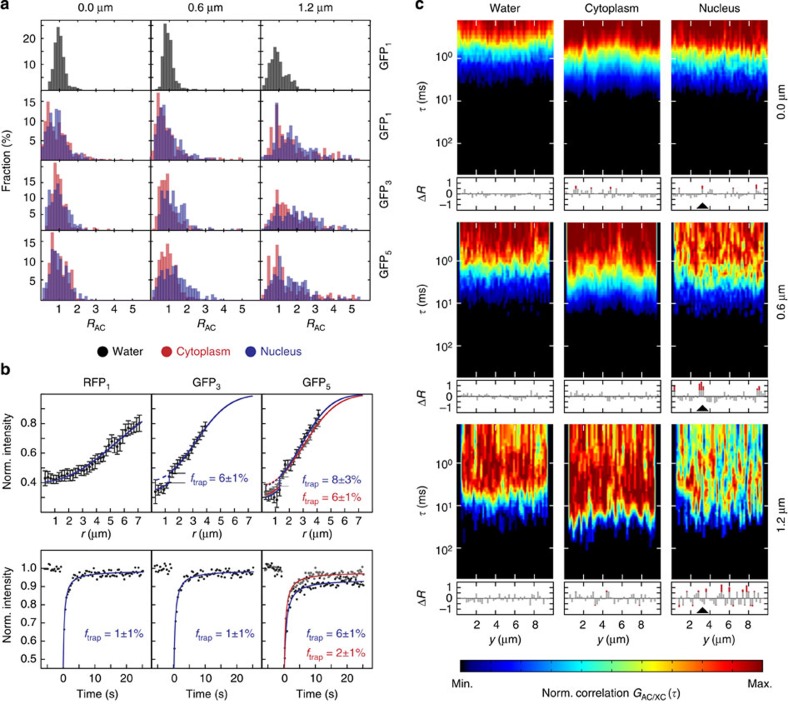
Figure 3. Diffusion coefficients, trapped protein fractions and diffusion barrier density determined for GFP in living cells.
(a) Histograms for the retardation coefficient RAC=DAC/D (n>200 values). The parameter RAC corresponds to the translocation time of GFP monomer (GFP1), trimer (GFP3) and pentamer (GFP5) molecules relative to the average value obtained from the AC analysis. Measurements were conducted at about 50 positions equally distributed on a 10 μm long line for separation distances of 0 μm (AC), 0.6 μm and 1.2 μm (XC) in water, the nucleus and the cytoplasm. (b) FRAP measurements of RFP1 (n=12 cells), GFP3 (n=13 cells) and GFP5 (n=12 cells). The fraction of trapped protein ftrap was obtained from the fit of either the post-bleach radial intensity profile after 100 ms with Supplementary Equation (29) (top row) or the average recovery curve with Supplementary Equation (30) (bottom row). Diffusion coefficients were determined from the average recovery curves. Data are mean values, error bars represent s.e.m. (c) Representative AC and XC carpets (0 μm, 0.6 μm and 1.2 μm separation distance) for GFP1 in water, nucleus and cytoplasm. Regions with diffusion barriers can be identified from the fold increase of the translocation time ΔR plotted below the carpets. Negative ΔR values correspond to a decrease of the translocation time. An example for a diffusion barrier that is most pronounced for the 0.6 μm separation distance is marked with an arrowhead. Norm., normalized.

