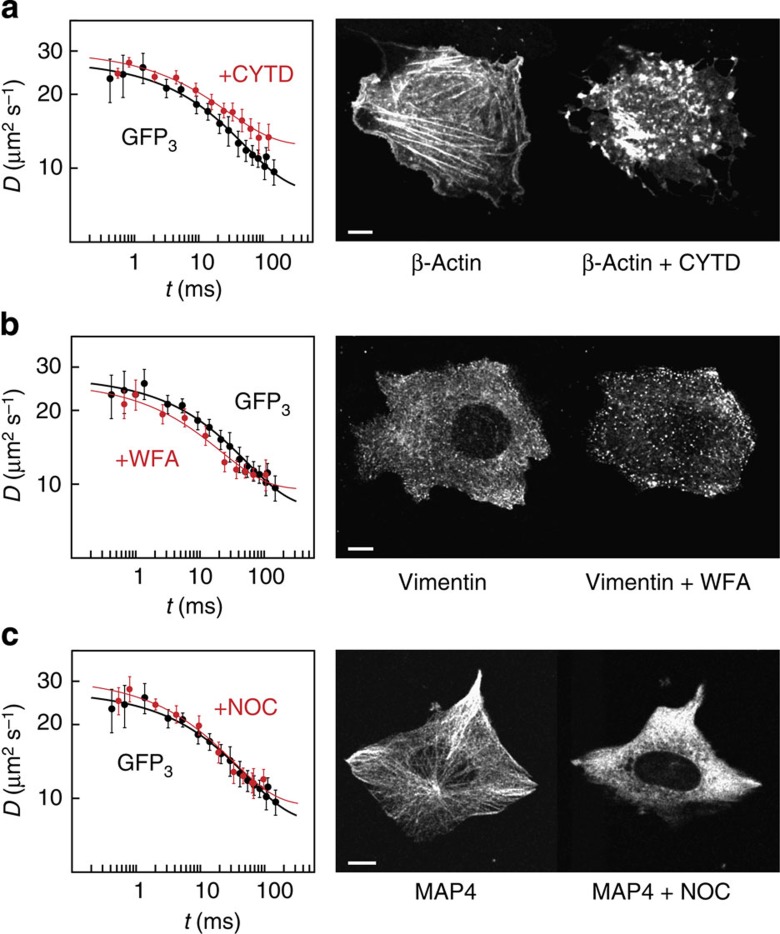
Figure 6. Mobility of GFP3 in the cytoplasm after disassembly of cytoskeletal filaments.
Time-dependent diffusion coefficients measured in U2OS cells after perturbation of the cytoskeleton (red) compared with that in unperturbed cells (black, n=19 cells). (a) Disruption of actin microfilaments by cytochalasin D (n=15 cells). (b) Disruption of vimentin filaments by withaferin A (n=16 cells). (c) Disruption of microtubules by nocodazole (n=14 cells). Data are mean values±s.e.m., fit curves correspond to Equation (1). Perturbations were validated based on the distribution of fluorescently tagged β-actin, vimentin or microtubule-associated protein 4 (MAP4), respectively. Scale bar, 10 μm.

