
Figure 2.
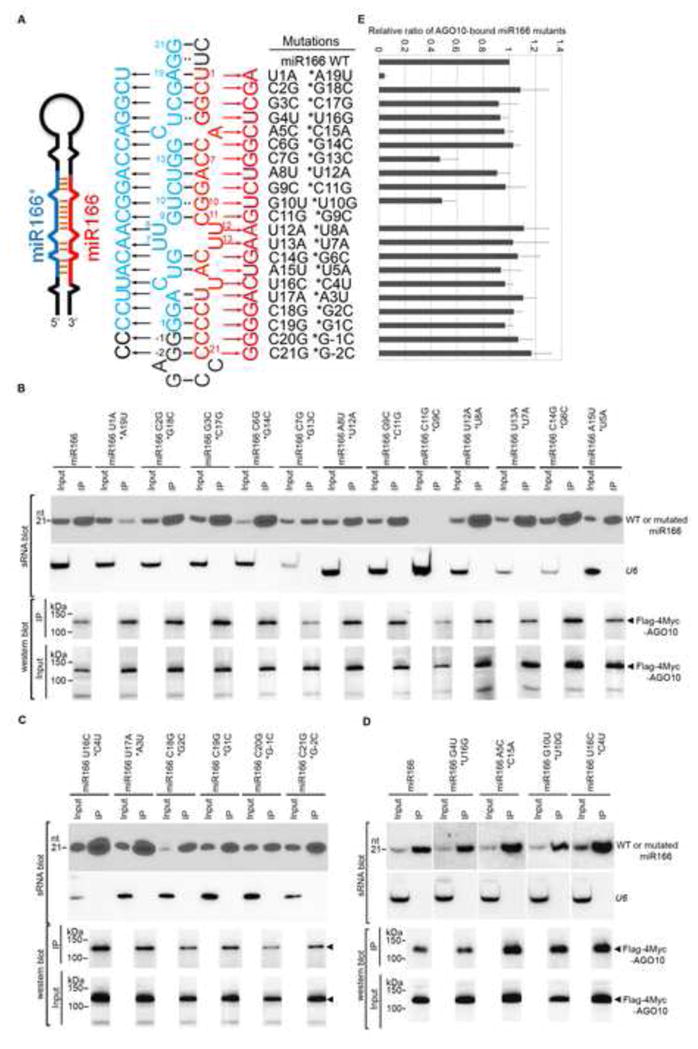
Few mutations in the miR166 sequence compromised miRNA loading into AGO10. (A) Schematics of point mutations in miR166 and its * strand. Predicted foldback of miR166a (Left panel). Paired single mutations in miR166 (red) and its * strand (blue) (Middle panel). The outside region of the miR166/166* duplex is shown in black. Numbers (i.e. 1–21) were given next to miR166/166* to show its orientation. −1 and −2 indicate their relative positions to the start of the miR166* strand. (B–D) Loading of miR166 mutants into AGO10 in N. bentha. Analyses of sRNA and western blots were conducted as in Figure 1E. (E) The relative mean signals of miR166 mutants/AGO10 were normalized to that of miR166/AGO10 with ±SD from seven experiments. Note: miR166 C11G *G9C was not detected in the input. See also Fig. S2.