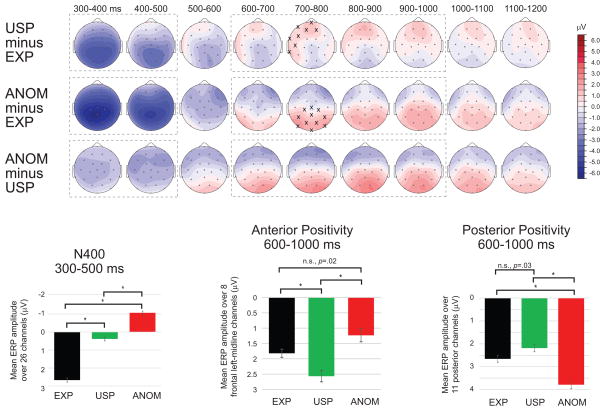
Figure 4.
Experiment 2 topographic scalp maps of ERP mean amplitude voltage differences for all possible conditional comparisons over consecutive 100 ms time windows from 300–1200 ms. Experiment 2 analysis time windows over which ERP mean amplitude ANOVAs were performed are indicated in dashed gray line boxes: 300–500 ms for the N400 and 600–1000 ms for the anterior and posterior positivities. Electrode channels highlighted with black “x’s” are those for which data was included in the statistical analyses for the frontal and posterior positivities. ERP mean amplitudes are plotted below in bar graph form across channels included in each analysis in the respective time windows. Error bars indicate SEM. All significant pairwise differences (using Bonferroni-adjusted significance levels) for condition contrasts are indicated with an asterisk (*), denoting p < .0167: those not reaching statistical significance are indicated with “n.s.”

