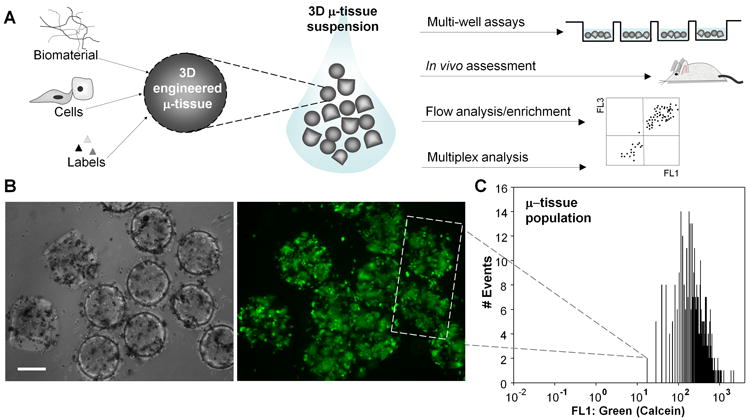
Figure 1.

3D μ-tissue suspensions. A) Schematic depicting the manipulation of 3D μ-tissue suspensions incorporating modular components of the microenvironment (biomaterial, cellular, identifying labels). Examination of μ-tissue populations enables 3D μ-tissue assessment in multiple formats (multiwell, in vivo) and integration with flow cytometric and multiplex analysis. Cytometric measurement and manipulation capabilities for intact μ-tissues are further outlined in SI Fig. 1. B) Liver (primary hepatocyte/J2-3T3 fibroblast) μ-tissue stained with the cellular calcein AM viability dye and imaged by phase contrast (left) and epifluorescent (right) microscopy. C) Viability profile of a representative 3D liver μ-tissue population, based on quantitative flow analysis of n=338 calcein-labeled liver μ-tissues. (Scale bar, 200 μm.)
