Figure 2.

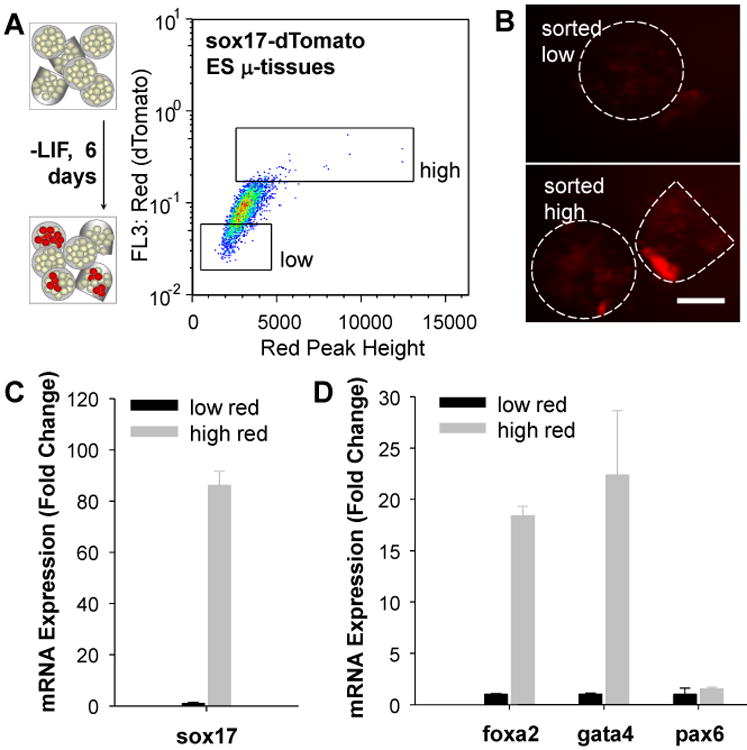
Flow analysis and enrichment of reporter 3D μ-tissues. A) 3D sox17-dTomato ES cell μ-tissues cultured in differentiation media (-LIF) for 6d and analyzed by flow cytometry based on red peak height vs. total red fluorescence. Fluorescence-activated sorting was used to enrich for high-red (dTomato)-expressing ES μ-tissues, compared to low-red controls. B,C) Gated high and low-red ES μ-tissues collected into a multiwell plate. Fluorescence imaging for dTomato intensity (B) and quantitative RT-PCR analysis of sox17 expression (C) confirmed reporter fidelity. D) Gene expression analysis of post-sort μ-tissues revealed additional endoderm marker (foxa2 and gata4) enrichment, without enrichment for the neuroectoderm marker, pax6. Error bars represent s.d. of the mean (n=3). (Scale bar, 200 μm.)
