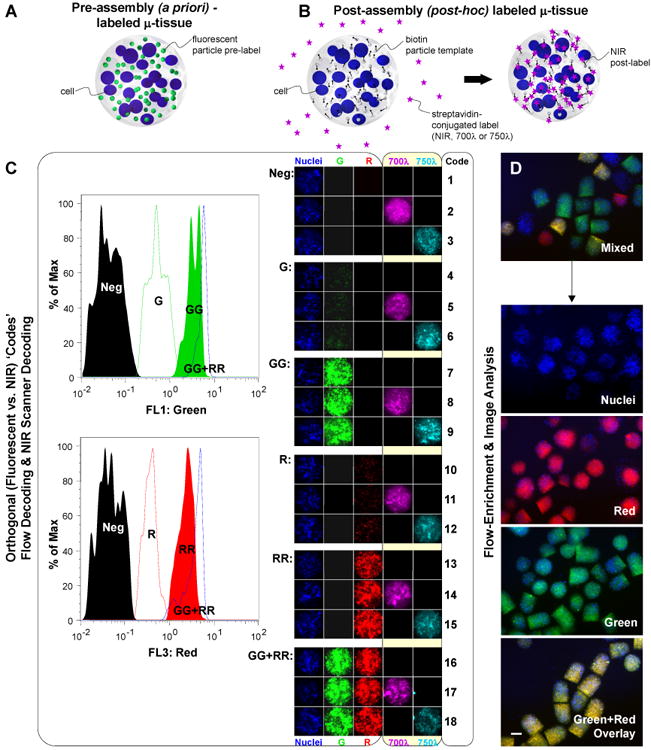
Figure 4.

Encoding μ-tissues for parallel analysis and tracking. A) Schematic of a pre-assembly (a priori) labeled μ-tissue comprised of encapsulated cells and fluorescent particle tags. B) Schematic of a post-assembly (post-hoc) labeled μ-tissue comprised of encapsulated cells and biotin particle templates, and reacted in solution with diffusible streptavidin-conjugated NIR tags. C) Orthogonal detection of 18 pre-determined μ-tissue ‘code’ combinations, using flow analysis for μ-tissue fluorescence wavelength and intensity (left panel) and microscopy imaging for μ-tissue NIR emission (right panel). Flow cytometry histograms (left panel) demonstrate the decoding of labels varying in intensity along a single channel λ=510 (Neg, G, GG), λ=610 (Neg, R, RR), or combined channels (GGRR). Images of representative μ-tissue ‘codes’ (right panel) illustrate the label combinations possible when expanding fluorescent particle tags with additional NIR tags. D) 3D μ-tissues pre-assembled with Cell Tracker Blue-labeled BMEL progenitors and quantum dot codes QD525 (green), QD605 (red), QD525+605, or no QD, are fluorescence-activated sorted to enrich a mixed multiplexed μ-tissue sample for distinct decoded μ-tissue populations. Representative epifluorescence images of mixed and decoded/purified samples are shown. (Scale bar, 200 μm.)
