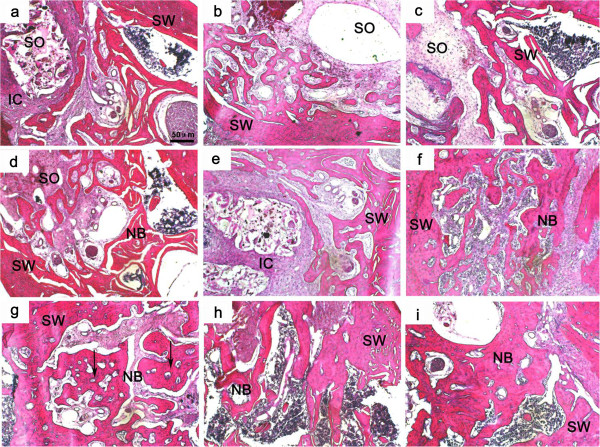
Figure 6.

Histological images by HE-stained tissue sections of tooth socket at different times after implanting operation. (a, d, and g) the PLGA/nHA/CMs/ADM group (4, 8, and 12 weeks, respectively); (b, e, and h) the PLGA/nHA/CMs group (4, 8, and 12 weeks, respectively); (c, f, and i) the blank control group (4, 8, and 12 weeks, respectively); NB: newly formed bone, SW: socket wall, SO: tooth socket, IC: inflammatory cells filtration, Arrows indicate bone lacuna. The scale bar: 50 μm.
