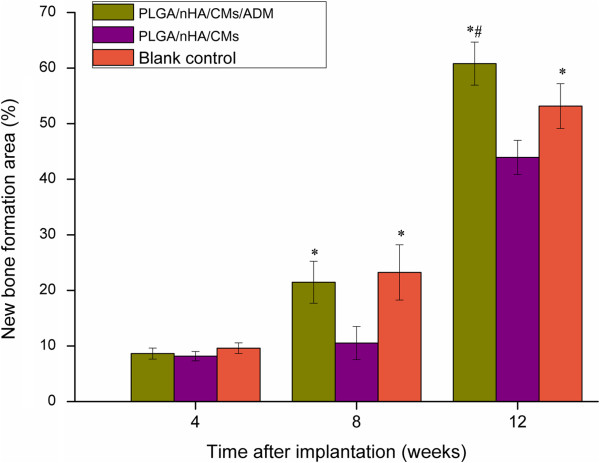
Figure 7.

Bone formation areas of various scaffolds at 4, 8 and 12 weeks after implantation. Mean values were compared by ANOVA and were significantly different at P<0.05. *statistically significant different compared with PLGA/nHA/CMs group. #statistically significant different compared with blank control group.
