
Extended Data Figure 5. Genotyping of chimeric mice.
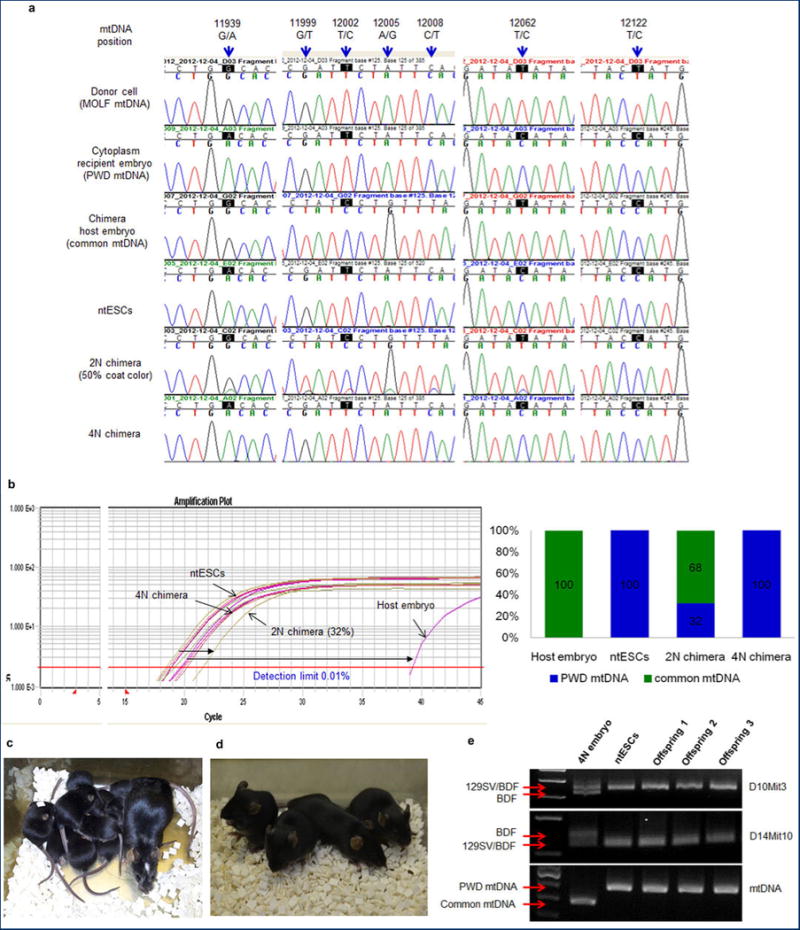
a, Chromatogram of mtDNA depicting sequence differences at base pairs (bp) 11939, 12062 and 12122 and demonstrating that mtDNA in ntESCs was derived from recipient embryo cytoplasm. Sequence differences between chimera host embryos and ntESCs at 11939, 12199, 12002, 12005, 12008 and 12062 bp allowed quantification of chimerism. The mtDNA from 2N chimeric mouse appeared as a double peak. The 4N chimera showed only ntESC mtDNA (GeneBank AY172335.1). b, Allele Refractory Mutation System quantitative PCR (ARMS-qPCR) assay in 2N and 4N chimeras. Similar colors indicate similar origin. Distances between color plots represent the contribution of chimeric host embryos. Amplification plot (left) and bar graph (right). Detection limit of this assay is 0.01%. c, High ntESC contribution chimeric female and her pups demonstrating germline transmission. White spot on the head of the dam originated from the ICR host embryo. d, Tetraploid (4N) embryo complementation pups born after ntESC (black) injection into host 8-cell stage 4N embryos. e, Genotyping of 4N complementation pups.