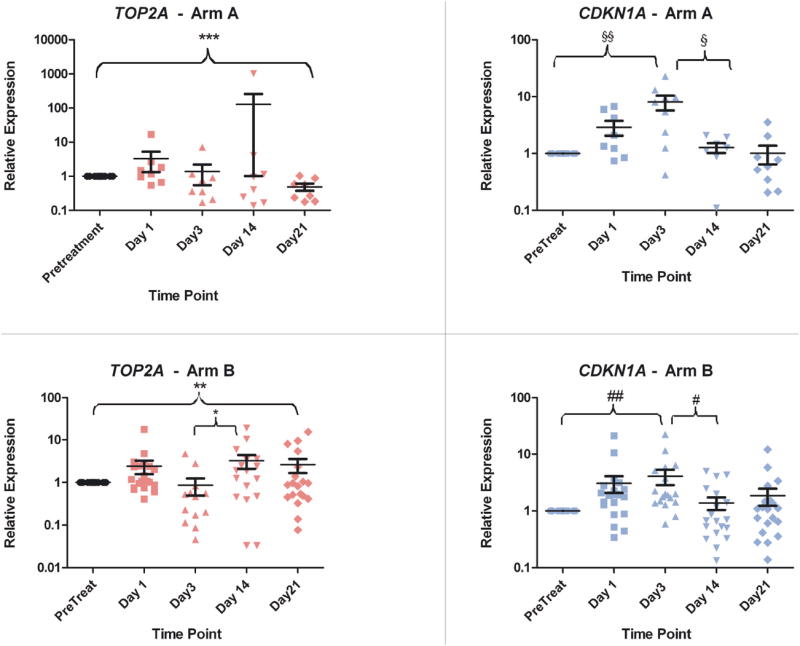
Figure 2. Expression Levels of Topoisomerase II and p21 by Treatment Arm.

Relative expression of DNA topoisomerase II (topo-II) and p21 by quantitative RT-PCR in patients separated by arm. Time points listed represent the day on study during which the sample was collected. Statistical values ***: p=0.016; **: p=0.984; *: p=0.049; §§: p=0.012; §: p=0.023; ##: p=0.0005; #: p=0.003
