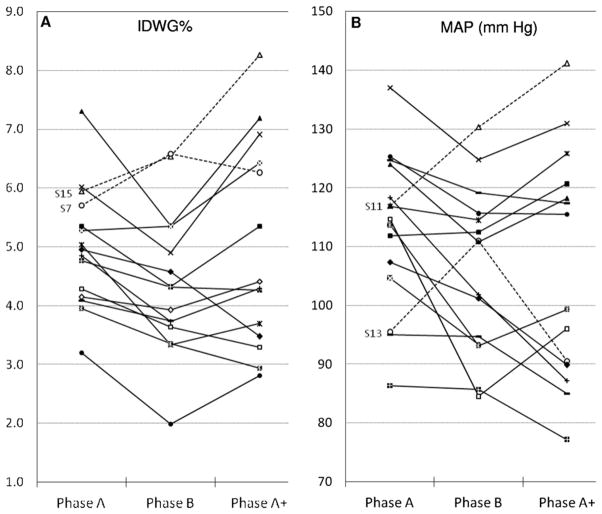
Figure 2.
(A, B) Individual changes in intradialytic weight gain (IDWG) indexed by the estimated dry weight (IDWG%) and predialysis mean arterial pressure (MAP) throughout the different study phases. (A) Dashed lines represent participants (patients 15 and 7) with increased IDWG%, but decreased predialysis blood pressures in phase B. (B) Dashed lines represent participants (patients 11 and 13) who experienced higher predialysis blood pressures without increasing IDWG% in phase A.

