
Fig. 1.
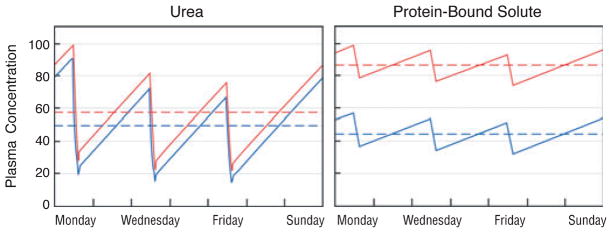
The predicted effect of increasing dialyzer size and dialysate flow on the plasma concentration of urea (left panel) as compared with a solute, which is 95% bound to plasma proteins (right panel). In the left panel, the red line depicts urea levels obtained with a conventional dialysis prescription designed to achieve single pool Kt/Vurea of 1.4 with a blood flow (Qb) of 360 ml/minute and a dialysate flow (Qd) of 500 ml/minute during a dialysis session lasting 3.5 hours. As depicted by the blue line, the predicted effect on urea levels of doubling both Qd and the mass transfer area coefficient KoA would be to reduce the time-averaged urea concentration by only about 15%. The reduction in time-averaged concentration (broken lines) is small because the urea clearance is a large fraction of the blood flow with the conventional prescription and the urea reduction ratio is already about 70%. The right panel depicts the effect of the same two prescriptions on plasma levels of a solute, which is 95% bound to plasma proteins. With the conventional prescription (red line), the clearance of the bound solute is less than a tenth that of urea and the solute reduction ratio is only about 20%. Doubling Qd and KoA would nearly double the clearance of the bound solute. If solute production stayed constant and the solute was cleared by no other route, this would reduce time-averaged concentration by almost 50% (blue line). Solute concentration profiles were obtained with a previously described computer program and using a distribution volume for the bound solute of 0.2 l/kg body weight, similar to the value observed by Martinez et al. (67). for p-cresol sulfate (68). The peak predialysis concentration has been set to 100 arbitrary units for both solutes.