
Fig. 2.
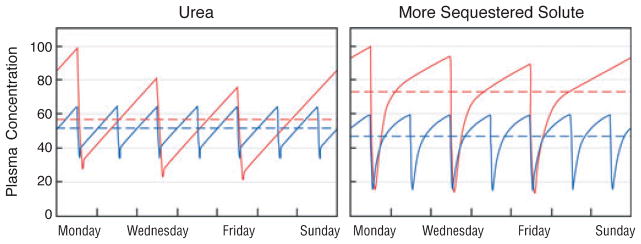
The predicted effect of increasing dialysis frequency from three to seven times per week on the plasma concentration of urea (left panel) as compared with a more sequestered solute (right panel). In the left panel, the red line again depicts urea levels obtained with a conventional dialysis prescription designed to achieve single pool Kt/Vurea of 1.4 during a dialysis session lasting 3.5 hours. The blue line depicts the predicted effect on urea levels of dividing the same 10.5 hours of total treatment time into daily 1.5-hour sessions while leaving other elements of the prescription constant. The reduction in time-averaged concentration (broken lines) is only about 10%. The right panel depicts the effect of the same two prescriptions on levels of a hypothetical solute, which is distributed in a 12-l compartment including the plasma, which is readily accessible to the dialyzer and a second 36-l compartment with passive movement between the first and second compartments characterized by an inter compartmental diffusion coefficient of 40 ml/minute. With conventional thrice weekly treatment (red line), the latter part of each treatment removes relatively little solute because the solute concentration in the first, accessible compartment has already been reduced to low levels. The plasma concentration exhibits prominent rebound following the end of each treatment as the first compartment is refilled from the second. Daily treatment with the shorter sessions results in more effective solute removal with a predicted reduction in the time-averaged solute concentration of about 35% (blue line). Solute concentration profiles were obtained with a previously described computer program assuming constant rates of solute production and no solute clearance by other routes (68).