
Figure 2.
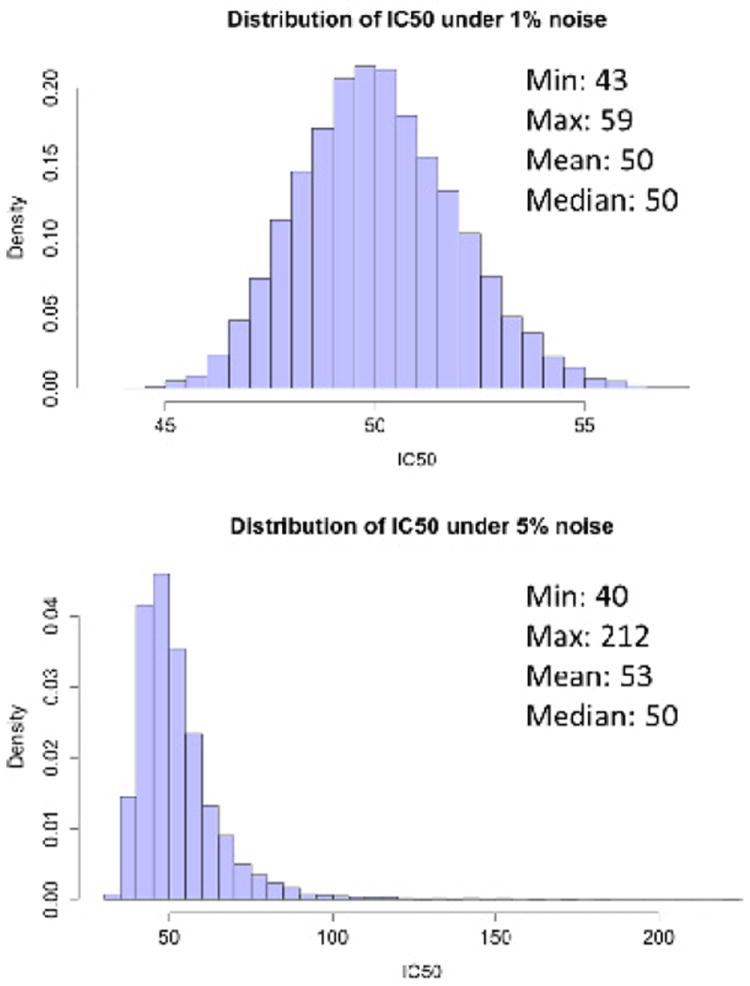
Distribution of the IC50 under two levels of noise. Note the wide range of estimated IC50s, especially under the slightly higher 5% noise model with many estimates being 2-3x larger the true value of 50 μM. Note also that the second histogram is no longer symmetric, implying that these IC50s are not normally distributed.