
FIGURE 1.
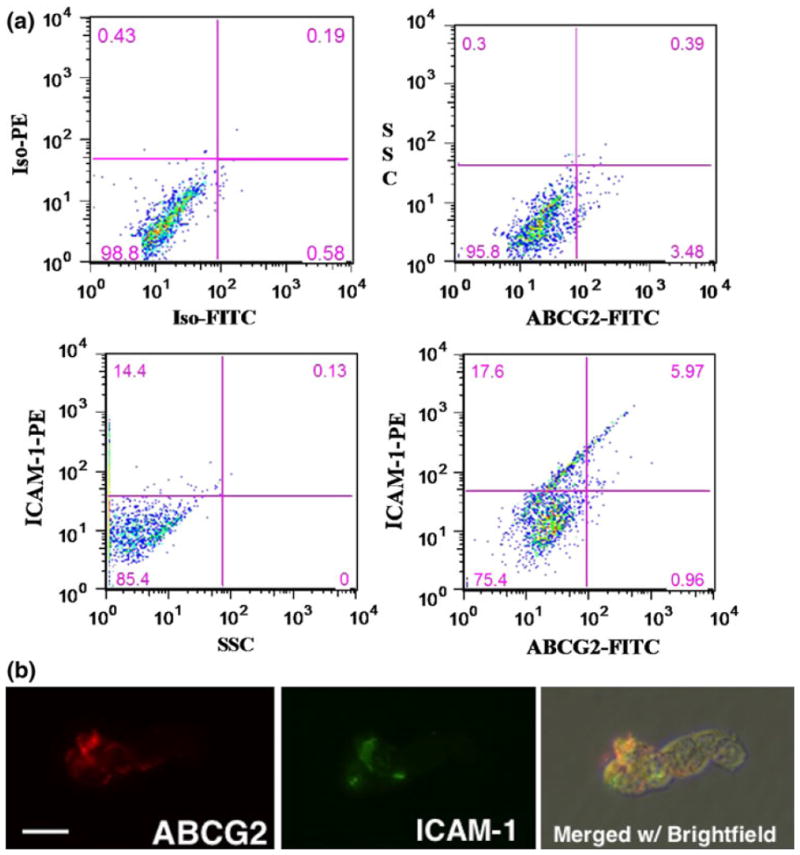
ABCG2+ RB cells preferentially express ICAM-1. (a) Detection of an ABCG2+/ICAM1+ subpopulation within RB143 cells labeled with FITC-conjugated anti-ABCG2 monoclonal antibody and PE-conjugated anti-CD54 (ICAM-1) monoclonal antibody. The upper left panel consists of isotype control antibodies (background), followed by panels for individual ABCG2 or ICAM-1 fluorescence. The lower right panel demonstrates double labeling and the degree of overlap between ABCG2 and ICAM-1. (b) Double immunofluorescent labeling of ABCG2 (red) and ICAM-1 (green). The same microscopic field is shown in all panels and merged with brightfield to display all cells in the field. Scale bar = 10 microns for all panels.