
Figure 9. Mean prediction  and identification accuracy of the SC2 and GWP2 models after (a) and before (b) translating the images in the validation set by 0.8° in a random dimension.
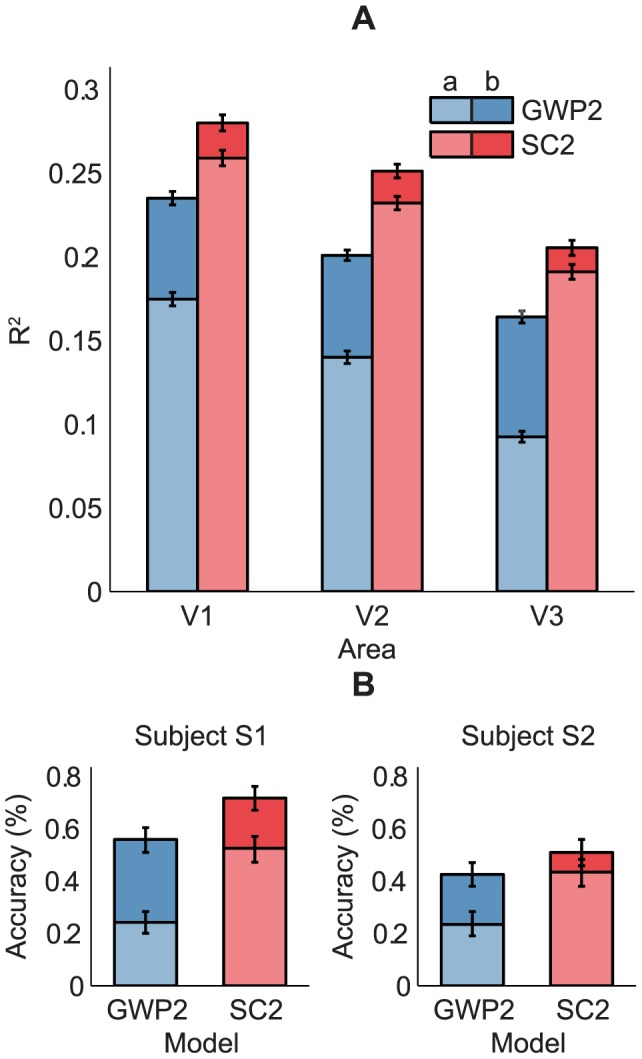
The SC2 model was more invariant than the GWP2 model and its invariance increased from V1 to V3. (A) Mean prediction  across the voxels that survived the
  threshold of 0.1 in the case of (b). Error bars show
  1 SEM across the voxels (bootstrapping method). (B) Identification accuracy. Error bars show
  1 SEM across the images in the validation set (bootstrapping method).