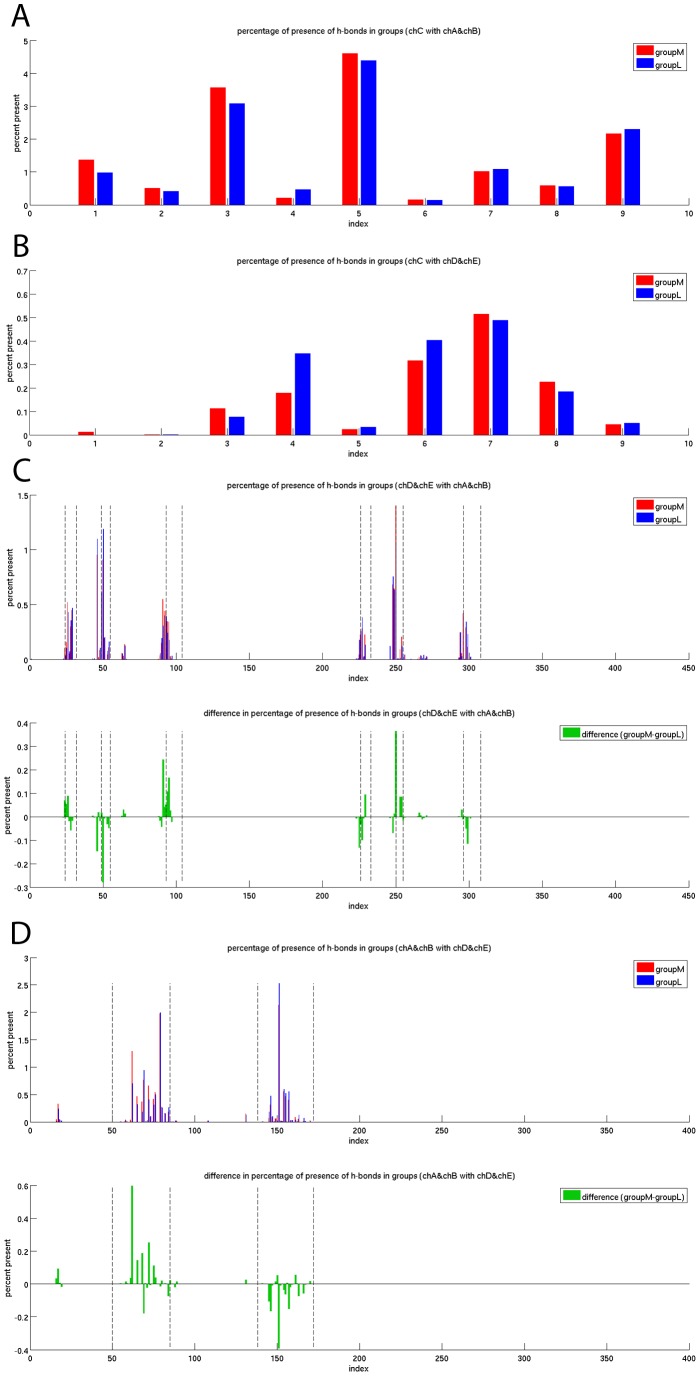
Figure 3. Hydrogen bond footprints of the 100 ns MD simulations of groupM and groupL.
The normalized frequency of occurring H-bonds over simulation time is shown. The frequency is zero if no H-bond is present in any frame of any of the simulations of the group. The frequency is one if one H-bond is present in each frame of every simulation of the group. The value can exceed one if in average more than one H-bond is present in a residue. (A) H-bonds between the peptide and the MHC. (B) H-bonds between the peptide and the TCR. (C) H-bonds between the two chains of the TCR and the MHC. The six CDRs are marked with dashed lines. (D) H-bonds between the MHC and the two TCR chains. The helices are marked with dashed lines.

