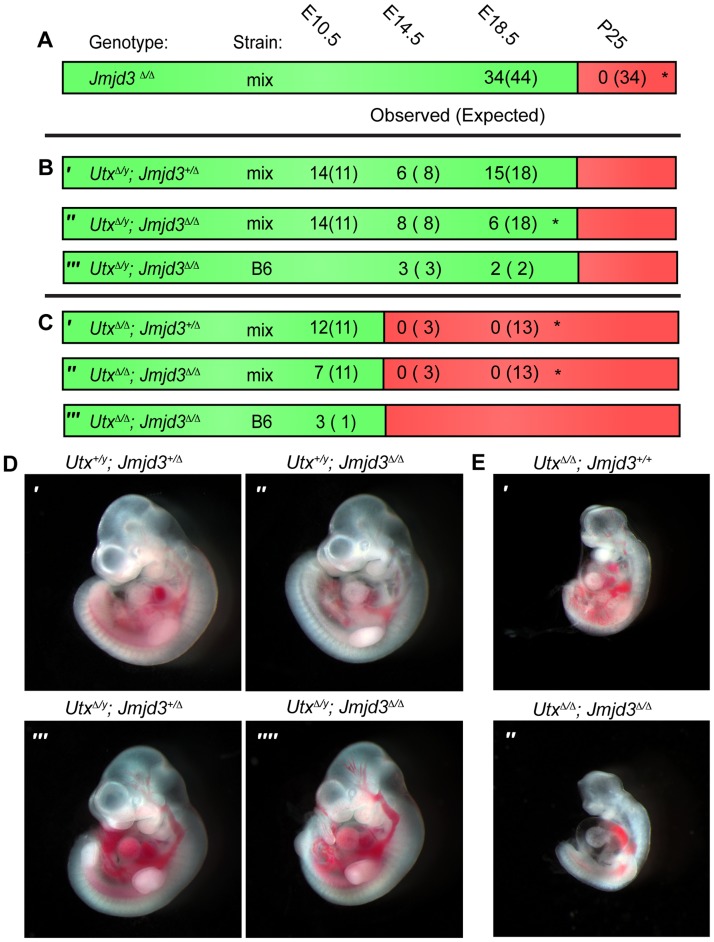
Figure 1. Utx and Jmjd3 mutant phenotypes.
(A–C) Observed and Expected (in parentheses) numbers of indicated genotypes at embryonic (day 10.5, 14.5 or 18.5) or postnatal (day 25, weaning) timepoints. Data are included for Jmjd3 Δ/Δ (A), Utx Δ/y;Jmjd3 +/Δ (B′), Utx Δ/y;Jmjd3 Δ/Δ (B″ and B′″), Utx Δ/Δ;Jmjd3 +/ Δ (C′), and Utx Δ/Δ;Jmjd3 Δ/Δ (C″ and C′″) genotypes. Green regions denote viability and red denotes lethality. Mix denotes a mixed genetic background and B6 has been backcrossed to C57BL6 for >5 generations. Significant deviations from expected allele frequencies as determined by χ2 p-value are: (A) *<0.001, (B) * = 0.005, and (C) *<0.001. (D,E) Embryonic day 10.5 images of (D) male Utx+/y;Jmjd3 +/Δ (D′), Utx+/y;Jmjd3 Δ/Δ (D″), Utx Δ/ y;Jmjd3 +/Δ (D′″), Utx Δ/ y;Jmjd3 Δ/Δ (D″″) embryos and (E) female Utx Δ/Δ (E′) and Utx Δ/Δ;Jmjd3 Δ/Δ (E″) embryos, B6 background.

