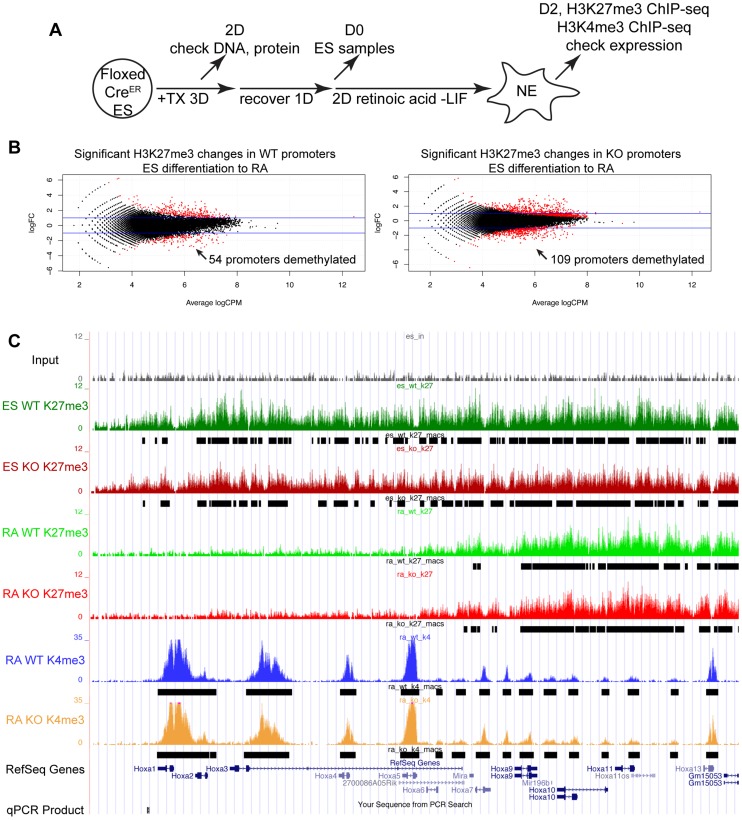
Figure 3. Proximal Hox genes demonstrate loss of H3K27me3 with RA treatment in the absence of KDM6 demethylation.
(A) Utxfl/fl;Jmjd3fl/fl;CreER ES cells were untreated (WT) or pre-treated with TX for 3 days (KO), recovered, and differentiated to neuro-ectoderm with 2 days of retinoic acid treatment. H3K27me3 and H3K4me3 ChIP-seq were performed on D0 ES cells and D2 RA treated cells. (B) The normalized sequence reads from all promoters (+/−1 KB KB) from ES and RA treated cells were compared by edgeR to identify promoters that exhibit H3K27me3 reductions in either WT (Utxfl/fl;Jmjd3fl/fl;CreER −TX) or KO (Utxfl/fl;Jmjd3fl/fl;CreER +TX) cells. The log fold change (logFC) is plotted against the average log counts per million reads (Average logCPM). In the plot, 54 WT and 109 KO promoters exhibited H3K27me3 reductions with RA treatment (negative logFC, FDR<0.05, and an identified H3K27me3 MACS peak in ES cells). (C) UCSC genome browser view of ChIP-seq tracks for the Hoxa cluster. Illustrated are Input (black), WT ES H3K27me3 ChIP (dark green), KO ES H3K27me3 ChIP (dark red), WT RA H3K27me3 ChIP (light green), KO RA H3K27me3 ChIP (light red), WT RA H3K4me3 ChIP (blue), KO RA H3K4me3 ChIP (orange), and MACS defined enrichment peaks are illustrated as black bars underneath each track. The RARE region tested by ChIP-qPCR is noted on the bottom.

