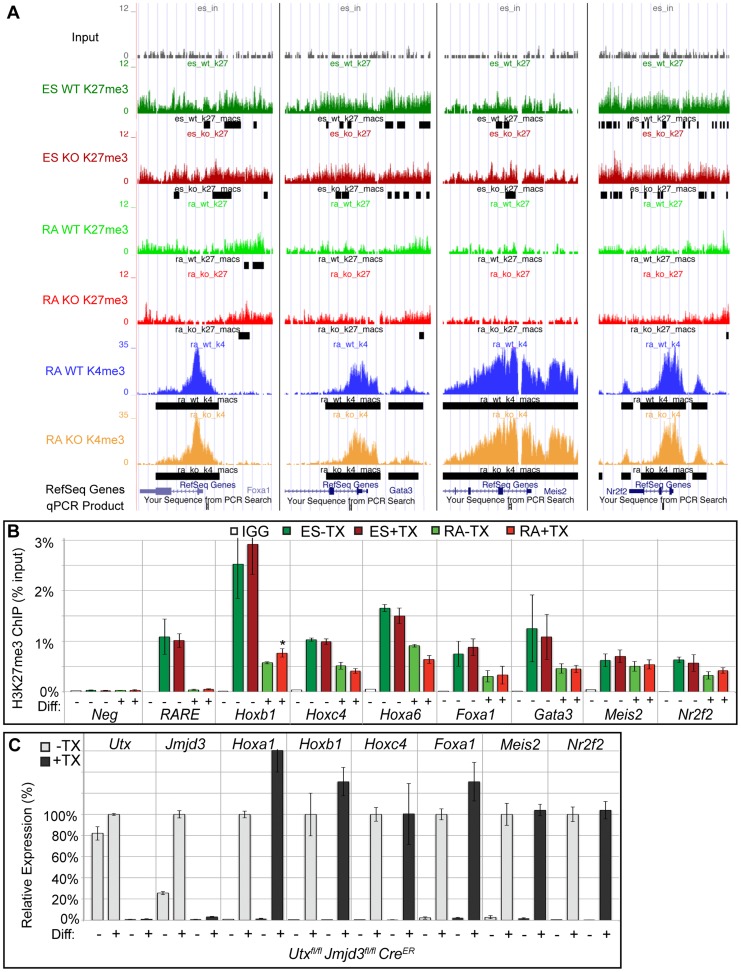
Figure 4. Several developmental genes demonstrate loss of H3K27me3 with RA treatment in the absence of KDM6 demethylation.
(A) UCSC genome browser view of Foxa1, Gata3, Meis2, and Nr2f2. Illustrated are Input (black), WT ES H3K27me3 ChIP (dark green), KO ES H3K27me3 ChIP (dark red), WT RA H3K27me3 ChIP (light green), KO RA H3K27me3 ChIP (light red), WT RA H3K4me3 ChIP (blue), KO RA H3K4me3 ChIP (orange), and MACS defined enrichment peaks are illustrated as black bars underneath each track. Regions tested by ChIP-qPCR are noted on the bottom. (B) Verification of H3K27me3 loss by ChIP-qPCR. H3K27me3 ChIP of Utxfl/fl;Jmjd3fl/fl;CreER ES cells (dark green and red, Diff −) or after 2 days of RA treatment (light green or red, Diff +) left untreated (green) or pre-treated with tamoxifen (red). An IgG control ChIP is illustrated as white bars. Quantitative PCR of a H3K27me3 negative locus (Slc2a8 promoter, Neg) was utilized for comparison to the Hox A cluster retinoic acid response element (RARE), Hoxb1, Hoxc4, Hoxa6, Foxa1, Gata3, Meis2, and Nr2f2 promoters. N = 4 samples per treatment. All genes tested exhibited demethylation in both WT and KO cells, with only Hoxb1 demonstrating a slight, but significant increase in KO RA treatment (p-value = 0.03). (C) Quantitative RT-PCR of Utx, Jmjd3, and indicated Hox genes, Foxa1, Meis2, and Nr2f2 from Utxfl/fl;Jmjd3fl/fl;CreER ES cells (Diff −) or after 2 days of RA treatment (Diff +) left untreated (−TX, light grey) or pre-treated with tamoxifen (+TX, black). N = 3 samples per treatment. All samples are normalized relative to −TX Differentiation + RA treatment. No genes tested demonstrated significantly reduced expression in KO RA cells.

