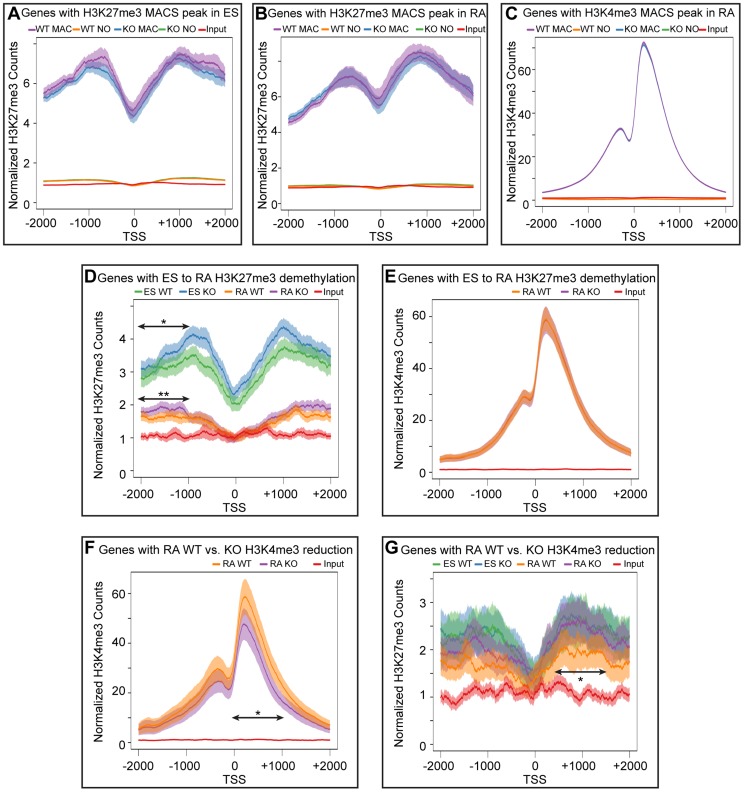
Figure 6. Meta-analysis of H3K27me3 and H3K4me3 distribution across female KDM6 WT and KO promoters.
(A) Meta-analysis plotted the normalized H3K27me3 sequence reads and corresponding 95% confidence interval for all female KDM6 WT and KO ES promoters with a H3K27me3 MACS peak against all promoters without a MACS peak. Gene distributions span −2000 base pairs upstream of the transcription start site (TSS) to +2000 downstream. (B) Normalized H3K27me3 sequence reads for all WT and KO RA promoters with a H3K27me3 MACS peak against all promoters without a MACS peak. (C) Normalized H3K4me3 sequence reads for all WT and KO RA promoters with a H3K4me3 MACS peak against all promoters without a MACS peak. (D) Normalized H3K27me3 sequence reads across promoters identified by edgeR to experience H3K27me3 loss with RA differentiation. ES WT and KO vs. RA WT and KO are illustrated. While there is a large drop-off in both WT and KO RA counts, KO ES and KO RA was slightly elevated relative to WT ES and WT RA respectively across −1000 to −2000 (Ttest of means for all given promoters, p-value = *0.036, **0.019) (E) Normalized H3K4me3 sequence reads across promoters identified by edgeR to experience H3K27me3 loss with RA differentiation. RA WT and KO are illustrated. (F) Normalized H3K4me3 sequence reads across promoters identified by edgeR to experience H3K4me3 loss in KO RA relative to WT RA. RA WT and KO are illustrated. KO RA is significantly reduced across 0 to +1000 (p-value = *0.009). (G) Normalized H3K27me3 sequence reads across promoters identified by edgeR to experience H3K4me3 loss in KO RA relative to WT RA. ES WT and KO vs. RA WT and KO are illustrated. KO RA was significanly elevated relative to WT RA across +500 to +1500 (p-value = *0.040).

