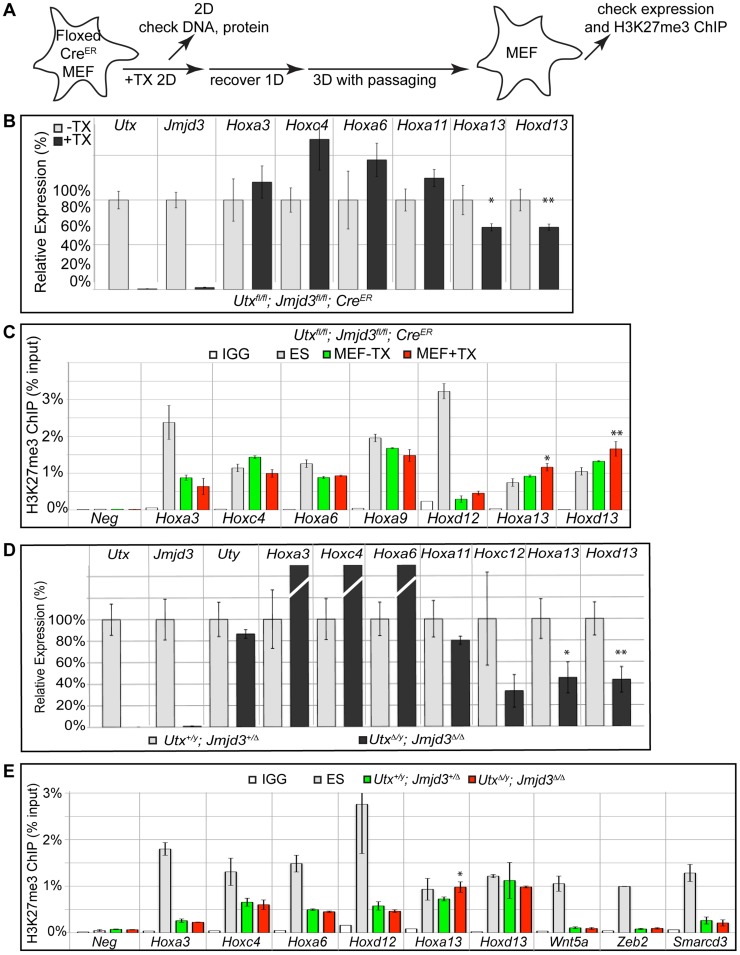
Figure 7. RT-PCR and H3K27me3 ChIP of Utx and Jmjd3 mutant MEFs.
(A) Schematic of MEF TX treatment. (B) Quantitative RT-PCR of indicated genes from Utxfl/fl;Jmjd3fl/fl;CreER mouse embryonic fibroblasts (MEFs) left untreated (−TX, light grey) or pre-treated with TX (+TX, black). Significant reductions in Hox expression are indicated (T-test p-value * = 0.05, ** = 0.02, N = 3 samples per treatment). (C) H3K27me3 ChIP of Utxfl/fl;Jmjd3fl/fl;CreER MEFs left untreated (green) or pre-treated with TX (red). An IgG control ChIP is illustrated as white bars and H3K27me3 ChIP of ES cells is illustrated as light grey bars. Quantitative PCR of a H3K27me3 negative locus (Slc2a8 promoter, Neg) was utilized for comparison to Hox promoters. Significant H3K27me3 accumulations of MEF +TX relative to −TX are indicated (T-test p-value * = 0.01, ** = 0.04, N = 3 samples per treatment). (D) Quantitative RT-PCR of indicated genes from Utx+/y;Jmjd3+/Δ (light grey bars) or UtxΔ/y;Jmjd3Δ/Δ MEFs (black bars). Significant reductions in Hox expression are indicated (T-test p-value * = 0.01, ** = 0.003, N = 3 independent MEF lines per treatment). (E) H3K27me3 ChIP of Utx+/y;Jmjd3+/Δ (green bars) or UtxΔ/y;Jmjd3Δ/Δ MEFs (red bars). An IgG control ChIP is illustrated as white bars and H3K27me3 ChIP of ES cells is illustrated as light grey bars. Quantitative PCR of a H3K27me3 negative locus (Slc2a8 promoter, Neg) was utilized for comparison to promoters of Hox genes and other indicated transcription factors. Significant H3K27me3 accumulations of UtxΔ/y;Jmjd3Δ/Δ MEFs relative to Utx+/y;Jmjd3+/Δ MEFs are indicated (T-test p-value * = 0.02, N = 3 samples per treatment).

