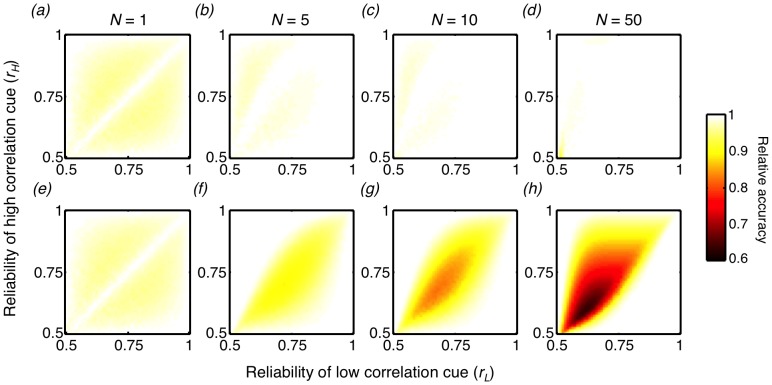
Figure 5. Comparing the accuracy of collectively and individually learned behavior to the accuracy of the optimal behavior.
(a–d) The collective accuracy resulting from the collectively learned behavior as a fraction of the maximum possible for that environment and group size, for all combinations of reliabilities of the two cues, for group size (a)  , (b)
, (b)  , (c)
, (c)  , and (d)
  . For each environment and group size combination, 500 simulations of 1000 training trials were performed, using a learning rate of
  , and the mean behavior of the last 100 trials across the simulations is reported. (e–h) The collective accuracy resulting from the behavior learned in isolation as a fraction of the maximum possible for that environment and group size.

