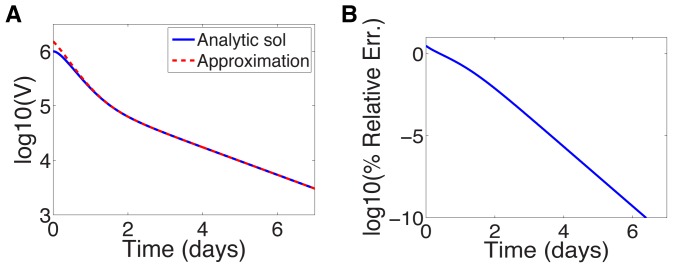
Figure 3. Approximate and analytic solution of VE model.
(a) Comparison of analytic solution (equation (11)) and the approximation (equation (16)) assuming sibilinin treatment (see Table 1 for parameters) and initial viral load of  . (b) Relative error in
  of approximation.

