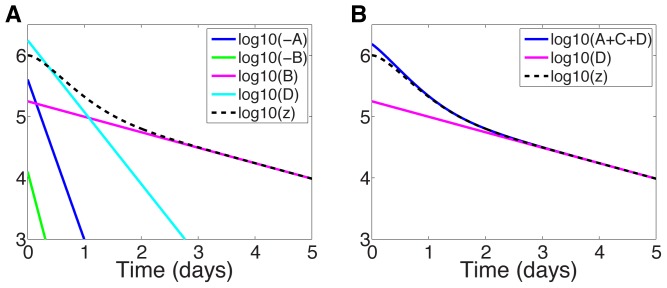
Figure 4. Different exponential terms in approximate solution (16) compared with the exact solution and for silibinin treatment parameters, for which  (see Table 1).
(a) Exponential terms from (16) plotted separately. (b) Exponential terms from (16) plotted in combined form.

