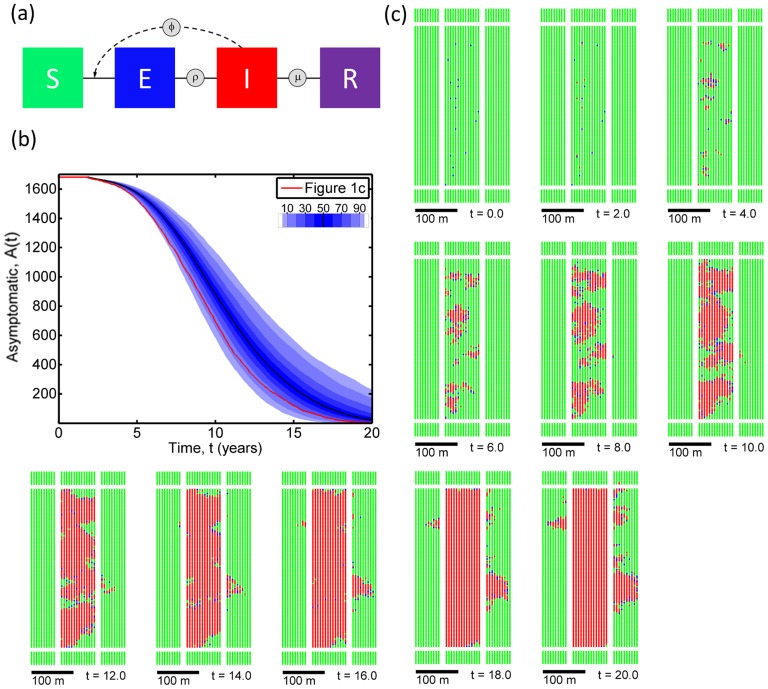
Figure 1. The underlying model and typical results without control.
(a) The compartmental structure of the (S)usceptible, (E)xposed, (I)nfected, (R)emoved model. (b) Spread of disease in a typical grove when there is no control, showing the number of asymptomatic plants within the central grove ( ) as a function of time,
  , starting with 1% of hosts (i.e. 17 plants) exposed to the pathogen at
  , and sampling parameters
  randomly on each run independently from the joint posterior parameter distribution obtained in model fitting. The density of shading shows the distribution of
  at each value of
  (1000 independent simulations). Breaks between different colours are at the
  and
and  percentiles, with the
  percentile marked by the black curve. (c) Snapshots of disease spread from the single realisation shown by the red curve in Figure 1(b); green corresponds to healthy trees (S), blue to trees that have been infected but are not yet infectious (E), and red to trees that are able to infect other trees (I). Since there is no control, no trees enter the (R)emoved compartment.

