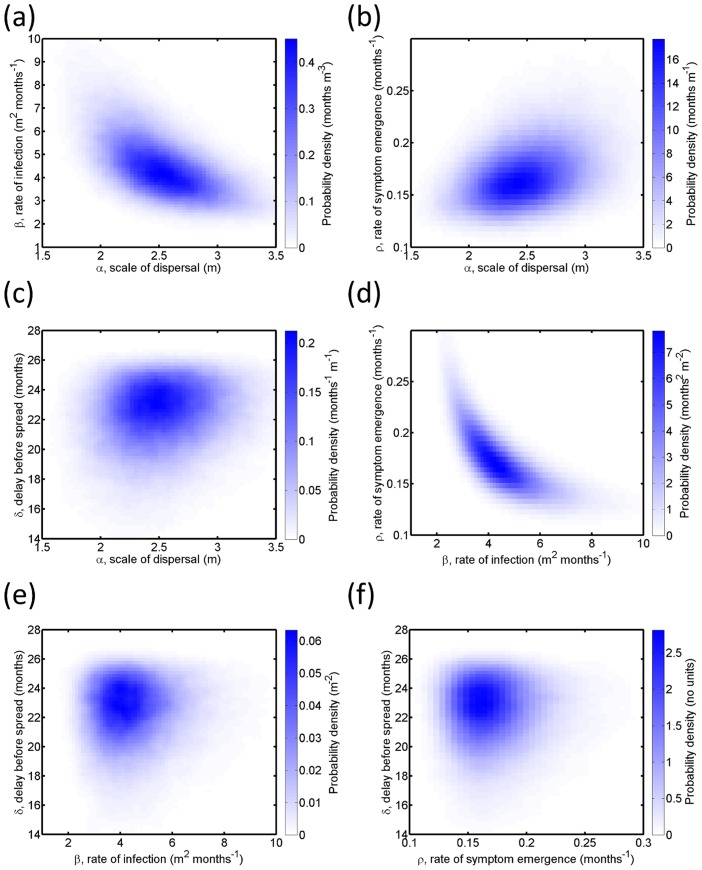
Figure 3. Posterior distributions of parameters.
(a)-(f) Pairwise joint posterior distributions for the scale of dispersal,  ; the rate of infection,
  ; the rate of emergence of infectivity,
  ; and the delay for plants to reach epidemiological maturity,
  . These estimates were obtained by fitting to the experimental data via MCMC with data augmentation. 95% credible intervals:
  ,
,  ,
,  and
and  .
.

